Operations | Monitoring | ITSM | DevOps | Cloud
April 2022
Monitor Knative for Anthos with Datadog
Developed and released by Google in 2018 with contributions from IBM, VMWare, Red Hat, and other companies, the Knative project is designed to make it as simple as possible to build, deploy, and scale serverless containers across your existing Kubernetes infrastructure. By operating on top of Google Anthos, Knative for Anthos takes this even further by allowing developers to build and deploy applications across any hybrid environments that include both on-prem and cloud-hosted serverless clusters.
Best practices for monitoring mobile app performance
In a crowded and competitive market, mobile app developers must offer continuous availability and a frictionless user experience to minimize churn. Monitoring and maintaining mobile apps presents unique challenges. Since mobile apps run on a wide range of devices, it can be difficult to get clear visibility into client-side performance.
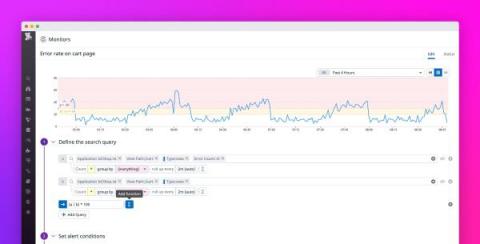
Use formulas and functions in RUM monitors for high-value alerts
Real User Monitoring (RUM) gives you visibility into the behavior of your users and the performance of your applications. You may already be using RUM monitors to automatically notify your team when the number of RUM events—such as pageviews, clicks, or errors—rises above a threshold you define.
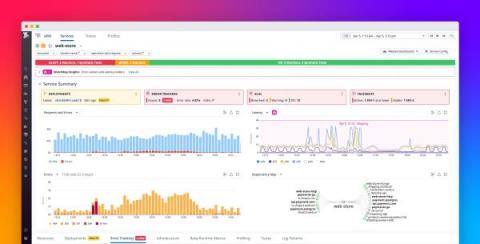
Explore a centralized view into service telemetry, Error Tracking, SLOs, and more
When your service is undergoing performance issues, it is essential to address them in a timely and frictionless manner. With access to more telemetry and insights, the APM Service Page provides a comprehensive overview of your service and helps you quickly drill down under the hood to diagnose and investigate issues.
Announcing support for Amazon EKS Blueprints
Amazon Elastic Kubernetes Service (EKS) is a managed container service designed to deploy and scale cloud-based or on-premise Kubernetes applications. AWS released EKS Blueprints to provide customers with a framework for creating internal development platforms on EKS.
Troubleshoot directly from any replay with Browser Dev Tools
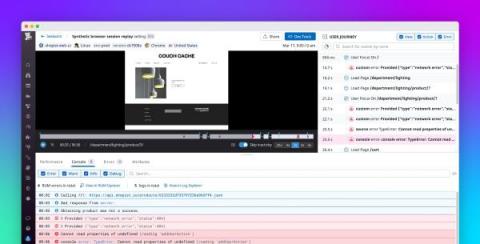
Session Replay now includes Browser Dev Tools, a new feature that enables engineers to identify and debug the root causes of issues even faster by exposing key information about a playback session, such as network performance bottlenecks and any console log errors. This wealth of surrounding context will make it easier to trace frontend incidents throughout your application and remediate larger, ongoing issues.
Successfully migrate to Azure with the Microsoft Cloud Adoption Framework and Datadog
Migrating your applications from on-prem infrastructure to the cloud comes with a number of benefits, including increased agility, resilience, and scalability, as well as potential cost and IT overhead reductions. But it can be complex, which is why organizations moving to Azure often use Microsoft’s Cloud Adoption Framework for Azure and its strategy for successful migrations.
Monitor your Redis Enterprise clusters with Datadog
Redis is an in-memory key-value data store that offers fast performance, flexible data structures, and multi-model databases, allowing it to handle a variety of use cases. Redis Enterprise enhances open source Redis with features designed to run distributed applications at scale, such as multi-tenancy, tiered data storage, active-active cluster replication, and support for up to five 9s of availability.
Accelerate incident investigations with Log Anomaly Detection
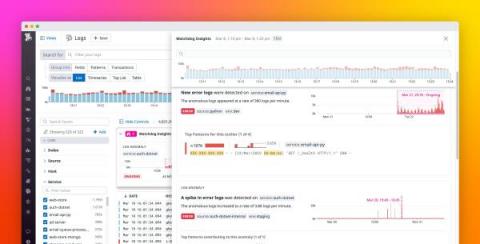
Modern DevOps teams that run dynamic, ephemeral environments (e.g., serverless) often struggle to keep up with the ever-increasing volume of logs, making it even more difficult to ensure that engineers can effectively troubleshoot incidents. During an incident, the trial-and-error process of finding and confirming which logs are relevant to your investigation can be time consuming and laborious. This results in employee frustration, degraded performance for customers, and lost revenue.
Troubleshoot faster with improved Datadog Events
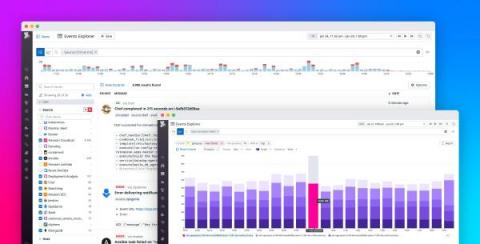
Datadog Events provides customers with a data feed about their infrastructure and applications, delivering an up-to-the-minute history of activity such as code deployments, configuration changes, and triggered alerts. Events collects data from Datadog products and over 100 third-party integrations—including Docker, Jenkins, Kubernetes, Sentry, AWS CloudWatch, and Azure Service Health.
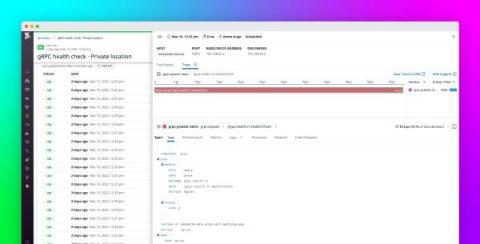
Monitor your gRPC APIs with Datadog Synthetic Monitoring
gRPC is an open source Remote Procedure Call (RPC) framework developed by Google and released in 2016. Although gRPC is still relatively new, large organizations are adopting it in increasing numbers to build APIs to connect complex microservice meshes that use disparate languages and frameworks. gRPC-based APIs can process requests up to seven times faster than REST APIs, and they also allow customers to easily implement SSL authentication, load balancing, and tracing via plug-in libraries.
Debug issues and automate remediation with Shoreline and Datadog
Shoreline is an incident response automation service that enables DevOps engineers and site reliability engineers (SREs) to quickly debug and remediate issues at scale and develop automated routines for incident management. Using Shoreline’s proprietary Op language, customers can run debug commands across all their hosts simultaneously and then deploy custom scripts via Actions to trigger automated remediations.
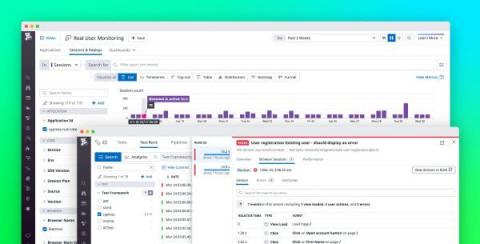
Troubleshoot end-to-end tests with CI Visibility and RUM
Adding automated testing to your CI/CD pipelines can help you ensure that you deploy changes safely. But as you continue to shift left, the number and complexity of tests are likely to increase, making them slower to run and harder to troubleshoot. Datadog CI Visibility can help you track the performance of your CI/CD pipelines and tests—and now you can also use Real User Monitoring (RUM) to monitor end-to-end (E2E) Cypress tests.


