Operations | Monitoring | ITSM | DevOps | Cloud

January 2023

Your Data Just Got a Facelift: Introducing Honeycomb's Data Visualization Updates

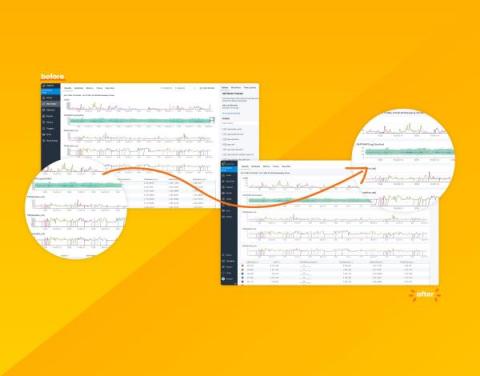
Data visualizations take complex information and present it in a clean and easy-to-understand visual. Done right, they can allow quick insight through easy pattern and outlier recognition. Done wrong, it can confuse, obfuscate, and lead to wrong conclusions. Yikes! Over the past few months, we've been hard at work modernizing Honeycomb’s data visualizations to address consistency issues, confusing displays, access to settings, and to improve their overall look and feel.

Surface and Confirm Buggy Patterns in Your Logs Without Slow Search

Incidents happen. What matters is how they’re handled. Most organizations have a strategy in place that starts with log searches—and logs/log searching are great, but log searching is also incredibly time consuming. Today, the goal is to get safer software out the door faster, and that means issues need to be discovered and resolved in the most efficient way possible.

Honeycomb, Meet Terraform

Most SaaS products have nice, organic growth when they work well. Employees log in, they click around and make stuff, then they share links with others who do the same. After a few weeks or months, there are thousand of objects. Some are abandoned, and some are mission-critical. Different people also bring different perspectives, so they name things that are relevant to their role and position in the team, which may be confusing to others outside their realm.

Jack Henry Incorporates BubbleUp and Honeycomb's New Service Map to Quickly Debug Issues and Get Ahead of Customer Latency

Not long ago, we announced the launch of Honeycomb’s Service Map, a new feature that gives users the ability to get an overall, filterable view of their system and how everything is connected, along with some exciting new enhancements to BubbleUp. What’s the story behind these changes? They make it even easier for developers to zero-in on issues, even when they are hidden in billions of lines of code.

Counting Forest Fires

If you were asked to evaluate how good crews were at fighting forest fires, what metric would you use? Would you consider it a regression on your firefighters’ part if you had more fires this year than the last? Would the size and impact of a forest fire be a measure of their success? Would you look for the cause—such as a person lighting it, an environmental factor, etc—and act on it? Chances are that yes, that’s what you’d do.

Authors' Cut Spark Notes Edition: Jumpstart Your Observability Journey

Whether you’ve been following along with our Authors’ Cut series or doing some self-paced learning, our O’Reilly book Observability Engineering is one of the best resources for jumpstarting your observability journey. It serves as a blueprint to help you understand and map out the technical and cultural requirements of implementing observability into your organization.

3 Easy Ways to Get Started With Distributed Tracing

Not to put too fine a point on it, but we think distributed tracing gets a very bad rap for being too complicated and labor-intensive. We’re here to show you three ways you can jumpstart a distributed tracing effort, starting small and expanding as it makes sense. These examples involve only a little code and perhaps a bit of a mindset change. Starting small with distributed tracing can even be fun, because who doesn’t like getting customized results without much work?

Author's Cut-A Sample of Sampling, and a Whole Lot of Observability at Scale

Brick by brick, block by block—if you’ve been with us throughout our Author’s Cut blog series (and if you haven’t, you can go catch up), you’ve seen us build the case for observability from the ground up. We’ve covered structured events, the core analysis loop, and use cases for managing applications in production—and that’s just to start.