Operations | Monitoring | ITSM | DevOps | Cloud

January 2022

How traceroute in the Synthetic Monitoring plugin for Grafana Cloud helps network troubleshooting

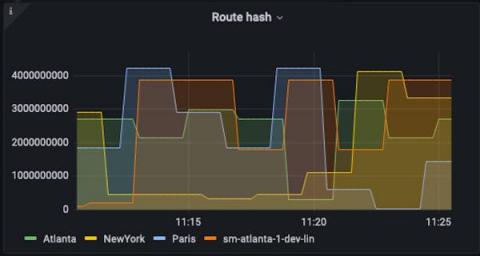
One of the powerful tools available in Grafana Cloud is Synthetic Monitoring, a black box monitoring solution that can provide insights that are hard to get in other ways. It provides a different view of your application by observing performance and uptime externally and from all over the world. As a result, you can build an understanding of what your end users are actually experiencing. However, as great as it is, synthetic monitoring does have limitations.

Video: How to build a Prometheus query in Grafana

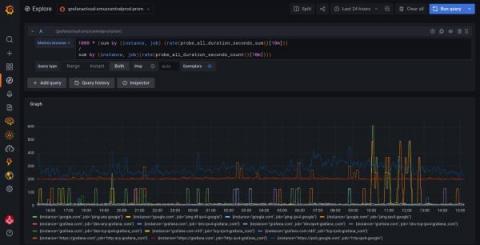
Once you have set up your Prometheus data sources in Grafana, it’s time to put them to work. In the one-minute tutorial video below, we show you how to build a query in Grafana 8.3 with Grafana’s easy-to-use Explore mode. Prometheus uses a query language called PromQL. If you are already familiar with PromQL, you can simply enter your query in the text field and run the query.

Grafana Tempo 1.3 released: backend datastore search, auto-forget compactors, and more!

Grafana Tempo 1.3 has been released! We are proud to add the capability to search the backend datastore. This feature will also appear soon in Grafana Cloud Traces. If you want to dig through the nitty-gritty details, you can always check out the v1.3 changelog. If that’s too much, this post will cover the big ticket items. You can also register for our upcoming webinar “Distributed tracing in Grafana: From Tempo OSS to Enterprise” on Jan.

A (de)bug's life: Diagnosing and fixing performance issues in Grafana Loki's read path

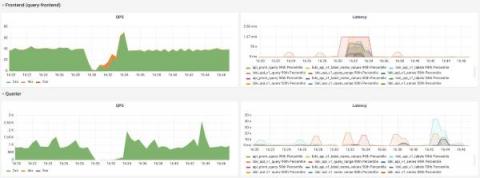
Beep, beep, beeeeeeeep. Read path SLO page, again. And I’ve almost found the noisy neighbor! That was me. And will probably be me again at some point in the future. As we continue to scale up the team that builds and runs Grafana Loki at Grafana Labs, I’ve decided to record how I find and diagnose problems in Loki.

A beginner's guide to network monitoring with Grafana and Prometheus

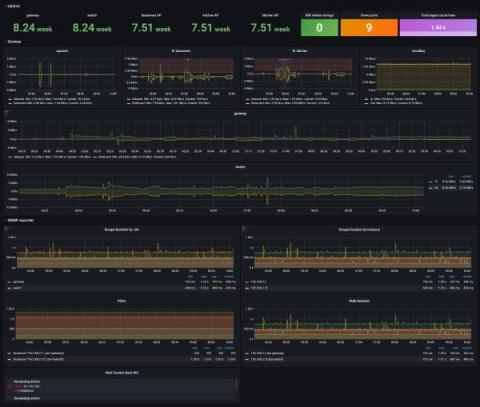
Networks are the backbone of inter-communications within computer systems and applications. When networks go down or experience any interruption of service, the impact is widely felt and can result in significant service disruptions and lost revenue. This is why network monitoring is mission critical for organizations. Visibility into network performance is key to ensuring that network engineering teams can be more proactive and identify problems before those issues cause outages.

All about the Grafana Labs Hackathon 2.0

After the success of our first company-wide hackathon last June, we committed to hosting more hackathons each year. So in December, Grafana Labs invited the company to once again press pause on the daily grind and commit five days to our second hackathon. And the Grafanistas showed up: 148 staffers (almost 20% more than the last round) signed on for the week-long event that involved virtual brainstorming, collaborative coding, and creative presentations.

Virtual offsite ideas that work: How the Grafana Cloud team brings together 150 people online

It was a Wednesday in November, and we had just wrapped Grafana Labs' third virtual Grafana Cloud offsite of 2021. Outside my window, it was a dark and cold (8 degrees Celsius) night in Cologne (Köln), Germany. In Austin, Texas, it was early afternoon and headed for 80 degrees Fahrenheit. In Cape Town, South Africa, it was a windy and cool spring evening. And in Melbourne, Australia, our final speaker — who was up very early at 5 a.m. — was heading into a cool spring day.

Configuring Grafana Tempo and Linkerd for distributed tracing

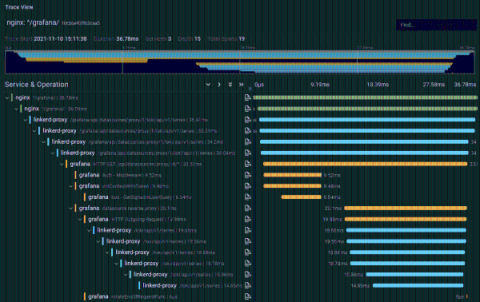
Anders Østhus is a DevOps Engineer on the Digital Tools team at Proactima AS, a consulting firm based in Norway that offers services and expertise in risk management, cybersecurity, healthcare, environmental solutions, and more. It can be difficult to orient yourself in the distributed tracing space, and getting all the parts of a tracing setup to play well with each other can be a bit tricky. But the benefits of tracing are undeniable.

Top 5 user-requested synthetic monitoring alerts in Grafana Cloud

We often hear from Grafana Cloud users who are asking for guidelines on how to write better alerts on synthetic monitoring metrics and get notified when synthetic monitoring detects a problem. We already ship a predefined alert in Grafana Cloud synthetic monitoring. A predefined alert that we ship is alerting on the probe_all_success_sum metric and makes use of the alert sensitivity config to create multiple Grafana Cloud alerting rules. Check out synthetic monitoring alerting docs for details.

Reducing MTTR and tracking SLAs with Grafana Cloud

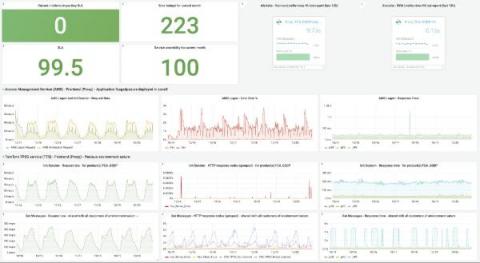
Attracting and retaining top developer talent is a No. 1 priority for a lot of companies these days, including location technology company TomTom. As both the builder of the world’s largest developer community and an employer of thousands of developers, TomTom is always looking for developer-friendly tools to help their employees feel productive, efficient, and inspired.

Building an effective remote-first team during the pandemic

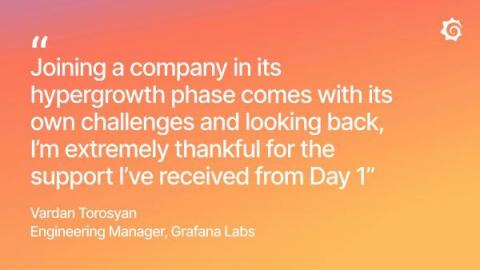
I’m an engineering manager at Grafana Labs serving on the Grafana Enterprise Operations team. I joined Grafana Labs in December 2020 and I just celebrated my first year at the company. The last 12+ months have been filled with the most exciting and rewarding experiences in my career, full of new opportunities and learnings. More importantly, I am lucky enough to meet and work with the wonderful people at Grafana Labs.

Learning the tricks of Grafana Loki for distributed logging at scale in a Kubernetes environment

Logging can provide immense detail when used well, or it can become a firehose and take hours to trawl through. The team supporting the Kubernetes platform at Civo needed a solution that was simple and performant and could be queried in ways to help and not hinder them In this talk, Civo SRE Anaïs Urlichs and Principal Engineer Alex Jones will illustrate how Loki was chosen and brought into the organization to empower engineers. Integrating with Prometheus and Grafana dashboards, Loki has allowed engineers to filter for precise information that helps them debug quicker.

How the new k6 Cloud app plugin makes it easy to correlate QA data and system metrics in Grafana

One of the common challenges when doing performance testing is the difficulty of correlating the metrics of your application with your testing results. Having available QA, infrastructure, and application metrics together allows engineering teams to better understand the behavior of their systems during the testing, helping to detect and prevent potential issues in their applications.

Five tricks for logging at scale in a Kubernetes environment with Grafana Loki

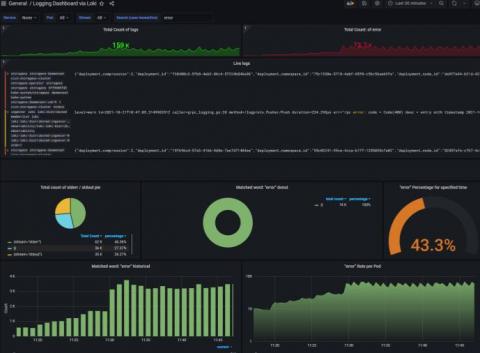
Legacy logging solutions simply couldn’t keep up with the complex, hyperconverged regional infrastructure at Civo, a Kubernetes service provider that enables users to launch k8s clusters within 90 seconds. “With our infrastructure and application deployment getting more complex and more distributed, we needed our logging solution and our entire observability stack to scale up with our needs,” said Anaïs Urlichs, Site Reliability Engineer at Civo.

Introducing Grafana University: our virtual hands-on education platform that's free and easy to use

Grafana Labs has had a long commitment to educating our customers and community about all of our open source technologies and products, with our community Slack, webinars, conferences, documentation, and of course, this blog. In 2021, we decided that it was time to create a formal education program to provide more structured, repeatable, and scalable learning experiences – all while providing the same compelling and quality content our community is accustomed to.