Operations | Monitoring | ITSM | DevOps | Cloud

Latest News

Dump Them for Sentry, Before They Can Break Up with You

Your customers are messaging, ordering, watching on a mobile device and — without a pause — carrying that experience to the web, desktop, tv, smart speaker, etc. Their expectations are that your service provides one seamless experience that goes with them where ever they are. That’s why you need resolution tools that work across organizational and technical boundaries. Now, maybe you’re tired of using an additional mobile focused tool when Sentry can cover both cases.

Everything You Need to Know About the Splunk Plugin for Grafana

Last week on Slack: Eldin: Hey Christine, do you remember the first time you viewed a log file? Christine: Oh yes. I used Splunk as a support engineer and I remember. You? Eldin: I believe it was early 2000s. I was installing Slackware and a few network cards for a DIY router, and logs were critical. Hello again! We are Eldin and Christine from Solutions Engineering – a team at Grafana that is passionate about connecting people to our products – reporting back for duty.

Evolving Blameless' SRE Practices with Amy Tobey

At Blameless, we drink our own champagne, and aim to adopt a mindset of continuous learning to foster resilience. We believe that the adoption of SRE practices is one of the best ways to get there. Like most organizations, our early efforts to implement SRE were imperfect. However, through hard work, teamwork, and investing in what we believe is the most important feature (reliability), we have made significant changes to how we do SRE. And we’re getting better at it every day.

AWS Elasticsearch Health Monitoring: 8 Things to Watch

If you have ever used a search bar on a website, you've probably used Elasticsearch. Elasticsearch is an open-source search and analytics engine used for full-text search as well as analyzing logs and metrics. It allows websites to use autocomplete in text fields, search suggestions, location or geospatial search. Tons of companies use Elasticsearch, including Nike, SportsEngine, Autodesk, and Expedia.

January 2020 Outage Report

Welcome to 2020, where Google Drive can fail for some of you but not others, you can’t access your passwords, and you can’t withdraw cash on vacation. This stranded on a desert isle dream was reality in the month of January, which saw drama in the financial services and internet infrastructure sectors. January’s downtime reinforces just how connected we have become, and how reliant we are on infrastructure that can seemingly fail on a whim.

Migrate Your Windows 2003 Applications to Kubernetes

There’s no one-size-fits-all migration path for moving legacy applications to the cloud. These applications typically reside on either physical servers, virtual machines or on premises. While the goal is generally to rearchitect or redesign an application to leverage cloud-native services, it’s not always the answer.

Help! My Collector is Down: Troubleshoot in 6 Steps

At the core of the LogicMonitor solution, there is the LogicMonitor Collector. The Collector is a small Java app installed on servers in your environment that collects monitored data from your various devices and then sends that data to LogicMonitor for retention and display. The Collector is what connects your environment to the cloud and allows you access from anywhere. However, sometimes these Collectors can go down, potentially leading to gaps in monitoring.

Decoupling Ruby: Delegation vs Dependency Injection

We've all worked with tightly-coupled code. If a butterfly flaps its wings in China, the unit tests break. Maintaining a system like this is...unpleasant. In this article, Jonathan Miles dives into the origins of tight-coupling. He demonstrates how you can use dependency injection (DI) to decouple code. Then he introduces a novel decoupling technique based on delegation that can be useful when DI is not an option.

Integrating Tracing and Logging with OpenTelemetry and Stackdriver

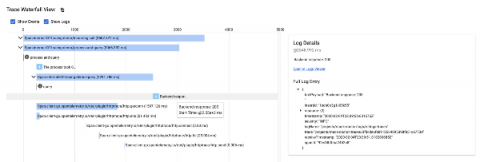
One of the main benefits of using an all-in-one observability suite like Stackdriver is that it provides all of the capabilities you may need. Specifically, your metrics, traces, and logs are all in one place, and with the GA release of Monitoring in the Cloud Console, that’s more true than ever before. However, for the most part, each of these data elements are still mostly independent, and I wanted to attempt to try to unify two of them — traces and logs.