Operations | Monitoring | ITSM | DevOps | Cloud
Latest News
Monitoring REST APIs with PowerShell and SCOM
Looking to get some REST endpoints monitors quickly? Follow the below steps to setup a could REST monitors in about 15 minutes (weather in this demo).
Embed Your Status Page Everywhere
A well-crafted status page is designed to save you time, energy, and resources when communicating service irregularities. Instead of fielding thousands of support requests when you experience an outage, a status page provides a self-service way for your customers to get up-to-the minute information about any current downtime. It also allows you to proactively communicate maintenance and other work in advance.
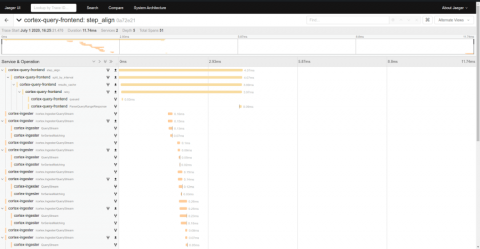
Where did all my spans go? A guide to diagnosing dropped spans in Jaeger distributed tracing
Nothing is more frustrating than feeling like you’ve finally found the perfect trace only to see that you’re missing critical spans. In fact, a common question for new users and operators of Jaeger, the popular distributed tracing system, is: “Where did all my spans go?” In this post we’ll discuss how to diagnose and correct lost spans in each element of the Jaeger span ingestion pipeline.
Monitoring Your Dynamic Cloud Infrastructure
Fully taking advantage of cloud infrastructure includes the ability to scale up and down dynamically, taking the need and load off your services. The compute services like Amazon Web Services (AWS) EC2, Azure Virtual Machines (VM), and Google Cloud Platform (GCP) Compute Engine allow Auto Scaling of the instances of the service. This helps manage the responsiveness and costs of your cloud services by ensuring that the instance counts go up and down depending on demand.
Monitoring Kubernetes in Production
Monitoring Kubernetes, both the infrastructure platform and the running workloads, is on everyone’s checklist as we evolve beyond day zero and into production. Traditional monitoring tools and processes aren’t adequate, as they do not provide visibility into dynamic container environments. Given this, what tools can you use to monitor Kubernetes and your applications?
Best practices for alerting on Kubernetes
A step by step cookbook on best practices for alerting on Kubernetes platform and orchestration, including PromQL alerts examples. If you are new to Kubernetes and monitoring, we recommend that you first read Monitoring Kubernetes in production, in which we cover monitoring fundamentals and open-source tools. Interested in Kubernetes monitoring?
Create Reproducible Security in Kubernetes with Helm 3 and Helm Charts
With the growing popularity of containerized applications, organizations and startups at all levels need to manage their Kubernetes deployments more safely at scale. Today, there is an expanding list of tools and services that can help do this. One of these services is the package manager known as Helm.
Chaos Engineering for a More Secure Kubernetes
Netflix, Amazon, Google, Facebook, and a host of other companies have adopted chaos engineering, which encourages designing systems to proactively ward off potential issues through testing and the anticipation of failure. When it comes to container orchestration tools like Kubernetes, chaos engineering is a vital tactic for enhancing security.
How to Create a Python Stack
All programming languages provide efficient data structures that allow you to logically or mathematically organize and model your data. Most of us are familiar with simpler data structures like lists (or arrays) and dictionaries (or associative arrays), but these basic array-based data structures act more as generic solutions to your programming needs and aren’t really optimized for performance on custom implementations. There’s much more than programming languages bring to the table.


