Operations | Monitoring | ITSM | DevOps | Cloud

Monitoring

The latest News and Information on Monitoring for Websites, Applications, APIs, Infrastructure, and other technologies.

Structure of Logs (Part 1) | Zero to Hero: Loki | Grafana

Have you just discovered Grafana Loki? Zero to Hero: Loki is a series of videos that aims to take you through the basics of ingesting, your logs into Grafana Loki an open-source log aggregation solution. In this episode, it's all about the structure of logs. In part 1 we cover what components make up a log entry. ☁️ Grafana Cloud is the easiest way to get started with Grafana dashboards, metrics, logs, and traces. Our forever-free tier includes access to 10k metrics, 50GB logs, 50GB traces and more. We also have plans for every use case.

GrafanaCON 2024 Keynote: Grafana 11, Loki 3.0, Alloy, Golden Grot Awards, and more | Grafana

During GrafanaCON 2024, we came back together in person for the first time since 2019. Grafana Labs CEO and Co-founder Raj Dutt announced the winners of the Golden Grot community dashboard awards, and members of our engineering team made some exciting announcements around our open source observability projects including Loki 3.0 and Alloy. And Torkel Ödegaard, the creator of Grafana, unveiled what’s new in Grafana 11, with some demos.

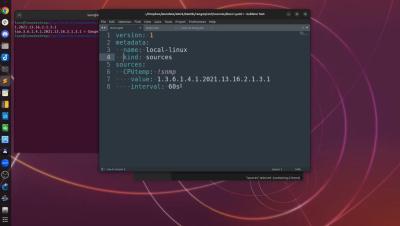
How to Configure Kentik NMS to Collect Custom SNMP Metrics

Join Kentik's Leon Adato as he explains how to customize Kentik's NMS (Network Monitoring System) to collect specific SNMP metrics not covered by default settings. Learn how to add custom SNMP elements, navigate YAML configurations, and organize your data for clarity. With practical steps and a linked blog for detailed guidance, this video empowers you to enhance your network observability in Kentik NMS. Ideal for those looking to tailor their monitoring setup without getting lost in complexity.

Discover Splunk - the unparalleled, most comprehensive full-stack observability solution

How do you become digitally resilient as an organisation? Hear from Maria Nyström, Regional Sales Manager at Splunk Sweden, about how Splunk is helping enterprises get full traceability in their environment. Splunk customers can trace any issue for any user and follow that to the application backend, the specific microservice and the infrastructure it runs on.

Mastering Live Debugging Techniques: A Must-Have Guide for Developers

Software debugging has undergone many transcendental shifts. These shifts are as fascinating as the transition from the biological origins of the term ‘debugging’ to its computer science incarnation. The moth that caused the first computer bug has led to a metamorphosis of the debugging scope to cover a much broader role in software development over the years. Live debugging is the latest manifestation of this evolution.

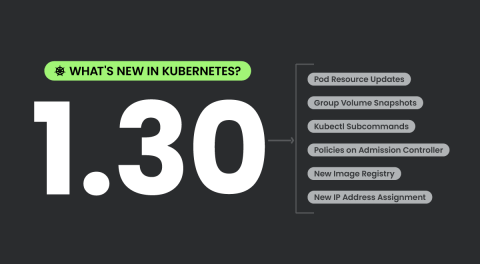
What's New in Kubernetes 1.30?

Kubernetes 1.30 brings a plethora of enhancements, including a blend of 58 new and improved features. From these, several are graduating to stable, including the highly anticipated Container Resource Based Pod Autoscaling, which refines the capabilities of the Horizontal Pod Autoscaler by focusing on individual container metrics. New alpha features are also making their debut, promising to revolutionize how resources are managed and allocated within clusters.

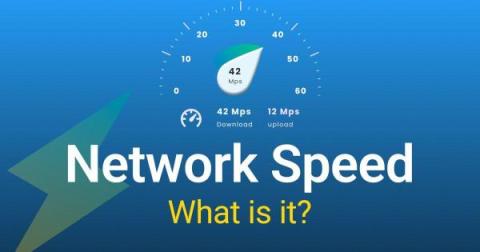
Network Speed Uncovered: What Is It Really & How to Measure It

When we talk about network performance, one metric that comes up constantly is "network speed." It's the measure of how fast your applications run, how swiftly you can transfer data, and, essentially, how responsive your digital world is. Speed in networking is like the speedometer in a car—it tells you how quickly things are moving. However, network speed isn't just about raw velocity.

The Leading Data Dashboard Examples

As organizations produce a significant amount of data from varying sources, simple analytics tools can make it challenging and time-consuming to derive insights from this data. Data dashboards can assist with this. A data dashboard is a visual representation of data that offers an at-a-glance view of key performance indicators (KPIs), metrics, and other important information relevant to a particular business, organization, or process.