Processing Log || Feature Highlight Video
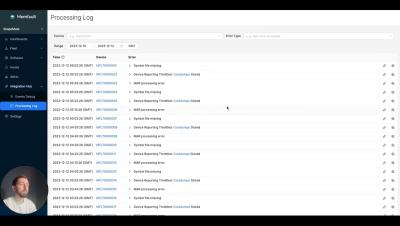
In this video we take a look at the newly released Processing Log. The processing log is designed to give developers working with Memfault an extra level of visibility into any errors happening on the Memfault server side to help them more quickly debug any issues.