Operations | Monitoring | ITSM | DevOps | Cloud

Debugging

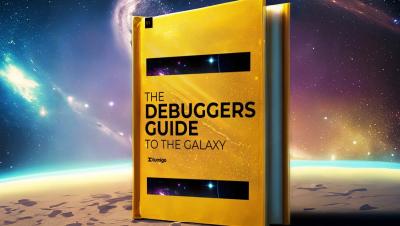
Debuggers Guide to the Galaxy - Promo Video

Grab your digital towel and embark on an intergalactic coding adventure with 'The Debuggers Guide to the Galaxy,' hosted by the serverless sage Yan Cui and the code-wielding DeveloperSteve. In a universe where devops are as perplexing as Vogon poetry and deployment seems guided by Infinite Improbability Drives, our hosts will guide you through the cosmic chaos. With introductions that defy normal spacetime and a dart container debugging session (using dartfrog) that's almost, but not quite, entirely out of this world.

A Modern C Development Environment

Sometimes, C/C++ projects have a long development cycle. When working on such a project, it can be easy to take our development environment for granted, and forget about the effort invested in its bring-up. The build environment works like magic, the test framework is neatly integrated, and the CI/CD pipeline relieves us of tedious, repetitive tasks.

Sponsored Post

Best practices for tracing and debugging microservices

Tracing and debugging microservices is one of the biggest challenges this popular software development architecture comes with - probably the most difficult one. Due to the distributed architecture, it's not as straightforward as debugging traditional monolithic applications. Instead of using direct debugging methods, you'll need to rely on logging and monitoring tools, coding practices, specific databases, and other indirect solutions to successfully debug microservices.

Debugging React Native Apps End-to-End: AMA with Experts from Meta and Sentry

With React Native, you can create native apps for Android, iOS, and more, in less time with less code. But debugging cross-platform apps can be challenging. In this AMA, hear tips and best practices from React Native experts, including developers from Meta and Expo.

Employing Coredumps to Debug Your Embedded Devices

Memfault knows firsthand how difficult identifying and solving the root causes of firmware faults can be, particularly for devices in the field. Local debugging and logging subsystems are commonly used to determine the issue cause, however, these tools are limited and invasive. This is where coredumps become helpful! Coredumps, an underutilized debugging resource, can provide valuable insights as they contain highly structured data that can be easily parsed.

Understanding Battery Performance of IoT Devices

I’ve been a firmware engineer at two wearable companies in the past, Pebble and Fitbit, and there was always one class of customer support tickets and user complaints that never went away: issues around battery life. It was a constant game of whack-a-mole with every new firmware version introducing a battery regression.

Debugging and troubleshooting microservices in production-All you need to know

What do you do when things break in production? Debugging microservices isn’t a walk in the park. Microservices are designed to be loosely coupled, which makes them more scalable and resilient, but also more difficult to debug. When a problem occurs in a microservices app, it can be difficult to track down the source of the problem. When the problem is in production, the clock is ticking and you have to resolve the issues fast.

Enhancements to Alerting and Notification Functionality in Memfault

In this video, I will be discussing the new enhancements that we have made to the alerting and notification functionality within Memfault. These enhancements include configurable incident start and end delays, the ability to decide when your team receives notifications during an incident, and increased control over the scheduling of incident summary notifications. Our goal is to reduce noise without sacrificing visibility, giving users greater control over notification and alerting behaviors. Watch this video to learn how to take advantage of these new features and improve your monitoring experience.

Feature Highlight Rollup by Cohort or by Software Version

In this video, I will be showcasing our newly released metric chart type called "Rollup by Cohort or by Software Version." This chart type provides an overtime view of your metric performance, allowing you to compare between software versions or cohorts. Unlike the existing chart types, which have an eight-week time window limitation, this new view enables absolute comparisons of performance across software versions. I will demonstrate how to make performance comparisons and explain the benefits of using this chart type. If you have any questions, please reach out to our team.