Operations | Monitoring | ITSM | DevOps | Cloud

RUM

How to Boost User Experience With RUM Software

According to a report by Google, mobile users abandon webpages if the load time is more than three seconds. In other words, even a fractionally slower website will lead to a bad user experience and increased bounce rates. Today’s users are more demanding and expect near-instantaneous load times and seamless experiences. If you can’t meet their expectations, they’ll find other websites or applications capable of providing a better experience.

Visualize performance trends over time with the latest graph for RUM

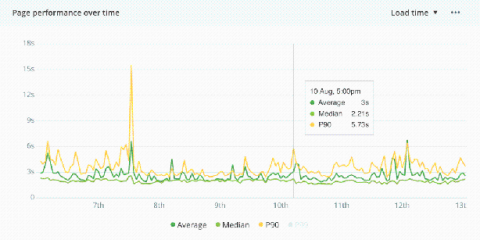
Monitoring trends in application performance helps you identify poor performance and visualize the impact of performance optimizations you’ve made. To help you better monitor performance trends, we’ve released a new line graph now available across all performance details pages in Real User Monitoring.

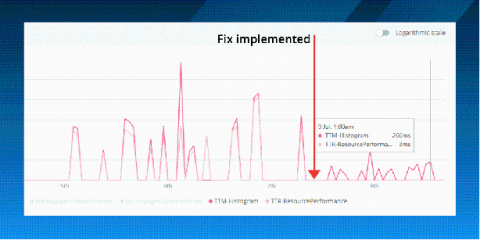
How we made an 83% performance improvement using Real User Monitoring

As applications evolve, we may start to lose visibility into why things are slow. Web apps often suffer in silence as customers are more likely to leave when they’re unsatisfied rather than reach out. Complex user flows, resource-intensive API calls, and an ever-growing codebase can all contribute to poor performance. This is why we don’t have scheduled performance days.

Improve mobile user experience with Datadog Mobile Real User Monitoring

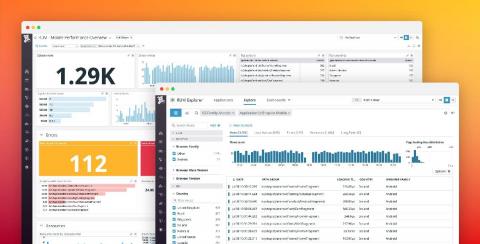
From gaming and social media to e-commerce and travel, mobile is reshaping the way businesses operate and engage with their customers. In an increasingly competitive market, ensuring your mobile applications stay highly performant and resilient will be critical in differentiating yourself from the crowd as well as avoiding uninstalls and poor app reviews.

Real User Monitoring vs. APM: What's the difference?

As modern development practices evolve at rapid rates we must stay focused on what makes for a great experience; fast, flawless software. In the pursuit of building fast, performant software, you’ve likely come across performance monitoring products like Real User Monitoring (RUM) and Application Performance Monitoring (APM). In this article, we go deeper into how using RUM and APM can help you and your team build better software experiences.

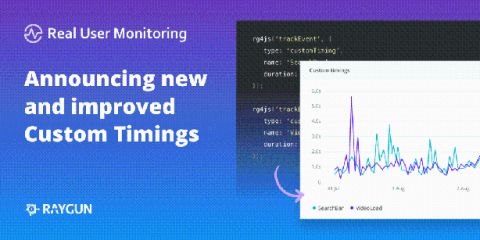
Track any web performance metric with improved custom timings for Real User Monitoring

Over the past few years, we’ve witnessed a couple of key trends in the performance monitoring space. Adoption of single-page applications (SPAs) has continued to grow and as such performance monitoring is evolving. SPAs don’t offer the same existing web metrics like load time or first paint from the browser performance API. As a result, developers require more flexibility to track the metrics that matter to their end-users and business.

Diagnose slow page requests with the latest addition to RUM

Earlier in the year, we launched the request details page in Raygun Real User Monitoring. This update brought the instance-level insights into page performance to help you understand exactly what caused poor performance and how to improve it. To complement instance-level insights, this latest launch brings the Latest slowest requests module to Real User Monitoring. Now, when viewing performance data for a specific URI, you can easily jump into the instance-level diagnostics for a specific slow request.

How to Effectively Monitor User Activity

Monitoring user activity on your website is a must if you want to run a successful and profitable online business. By implementing real user monitoring on your website, you can get an in-depth understanding of how your users are interacting with your website and the experience they receive. In this article, we discuss what real user monitoring (RUM) is and the benefits of using it. We’ll also share some best practices, so you’ll be ready to set up real user monitoring for your website.

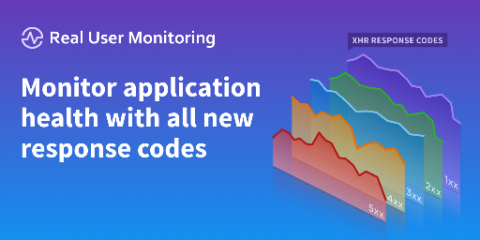
Monitor application health with the new response codes tab in RUM

In this release, we’re bringing an all-new section to Real User Monitoring to provide another way for you to monitor application health; the Response Codes tab. Real User Monitoring now tracks the response codes from XHR/AJAX calls made in your web application using the JavaScript provider. You can now: Stacked view of your application’s response codes This feature brings vital insight into the health of your applications so you can deliver the software experiences your customers deserve.

Benchmarking web performance: An actionable guide using Real User Monitoring

Customer experience is becoming a key differentiator between competitors. Actually, it already is! If your website is performing poorly, it’s hurting your business. The first step towards improving this performance is using a real user monitoring tool to identify problems and monitor your progress towards improvement.