Operations | Monitoring | ITSM | DevOps | Cloud

Profiling

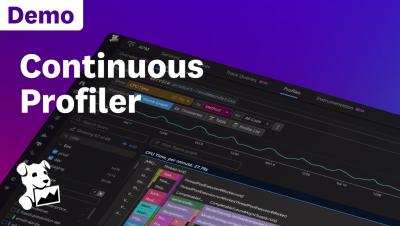
Get started with continuous profiling: Grafana Cloud Profiles

Watch a step-by-step demo of how to get started with Grafana Cloud Profiles, the hosted continuous profiling tool that gives you a cost-efficient way to better understand the resource usage of code. Plus, get tips on how to best leverage continuous profiling for better visibility into your observability stack.

An Introduction to Profiling in Node.js

CPU-bound tasks can grind your Node.js applications to a standstill, frustrating users and driving them away. You must master the art of profiling your application to pinpoint bottlenecks, and implement effective strategies to resolve any issues. In this guide, we'll explore various techniques to help you identify and fix the root causes of your Node.js performance issues. Let's get started!

Continuous profiling: The key to more efficient and cost-effective applications

Recently, Elastic Universal ProfilingTM became generally available. It is the part of our Observability solution that allows users to do whole system, continuous profiling in production environments. If you're not familiar with continuous profiling, you are probably wondering what Universal Profiling is and why you should care. That's what we will address in this post.

Understanding Request Latency with Profiling

It can be hard to figure out why response times are high in Java applications. In my experience, when engineers investigate this type of issue, they typically use one of two methods: They either apply a process of elimination to find a recent commit that might have caused the problem, or they use profiles of the system to look for the cause of value changes in relevant metrics.

Grafana Pyroscope 1.0 release: continuous profiling for a modern open source observability stack

When we launched Pyroscope in 2021, we had one clear goal: Give developers a powerful open source continuous profiling tool for collecting, storing, and analyzing profiling data. Grafana Labs had a similar goal when they released Grafana Phlare, a horizontally scalable, highly available open source profiling solution inspired by databases like Grafana Loki, Grafana Mimir, and Grafana Tempo.

Sentry Profiling now supports Browser Javascript, React Native, and Ruby

Profiling is an essential component of a developer’s toolkit for identifying and addressing the thorniest performance bottlenecks. Whether you’re a backend developer looking to cut down cloud infrastructure costs, a frontend developer trying to speed up page load times, or a mobile app developer working to ensure smooth scrolling for users, Sentry Profiling pinpoints hot code paths in your production environment, so you can identify and optimize the slowest parts of your code.