Operations | Monitoring | ITSM | DevOps | Cloud

Java

Monitoring Java in Docker: Overcoming past limitations

Before the release of Java 9 and 10, there were several limitations to deploying and monitoring Java in Docker. This post explores how the latest versions of Java address the most common of these limitations, and includes examples of how to make the most of monitoring Java in Docker.

A Java troubleshooting guide: network, memory leaks and threads

While the term ‘Java troubleshooting’ can apply to many, many scenarios, this post focuses on three particular long-standing Java production scenarios: a denial of service to a Java service endpoint, a memory leak, and troubleshooting a thread deadlock or race condition. Follow along as we use Java inside Docker containers to facilitate quick testing and show you how to use open source sysdig to quickly diagnose each troubleshooting scenario.

Java exceptions: Common terminology with examples [2018 guide]

The Java programming language comes with advanced exception handling features that help programmers manage exceptional events. In Java, exceptions are either thrown by the compiler or occur during the execution of the program. Exceptions stop the normal flow of the program, so you need to handle them appropriately.

Sentry's New Java Agent: Adding Context to Your Stack Traces

We’re enhancing the existing Sentry Java SDK with our new Java agent. The thing is — it’s still in beta, and we need your feedback. Once downloaded, the agent will enhance your application stack traces on Sentry by adding the names and values of local variables to each frame. Specifically, the agent provides much more detail about the current state of the application at the time of the error than you would usually have.

Monitoring Java using JMX and custom metrics

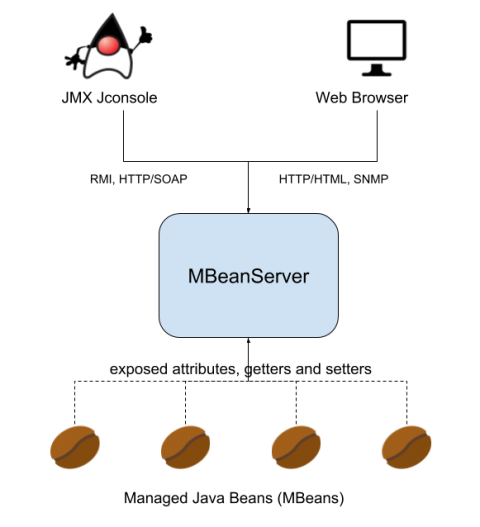
JMX (Java Management Extensions) is a set of specifications conceived to monitor and manage Java applications. To implement the JMX technology, you need to create and register MBeans (Managed Beans) as part of your Java code. Using JMX technology and tools, Java application developers can get the dynamic state of the application and use it for performance tuning, troubleshooting and debugging.

Monitoring Java applications: Memory usage, threads and other JRE metrics

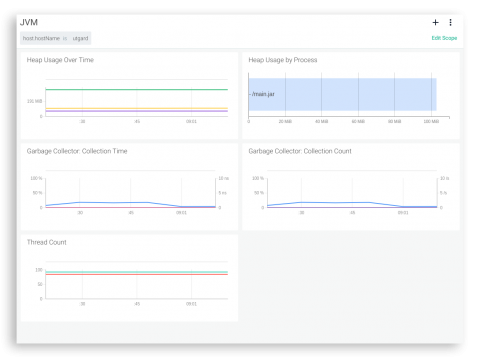
In this post we will cover how to monitor the Java Runtime Environment (JRE). You will learn how to assess the performance of your Java application by profiling its memory usage, the garbage collector metrics, monitoring Java daemon and user threads and other fundamental JRE metrics. We will finish with a real Java JRE troubleshooting example using opensource Sysdig and Docker.

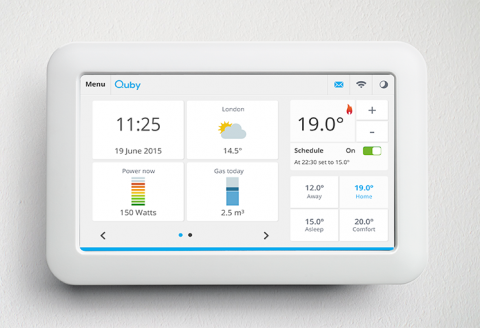
Monitoring and securing Java apps at Quby.

Moving to a Docker-based cloud for Java apps orchestrated by Mesos Marathon required a different approach to monitoring and security for Quby, the Amsterdam-based developer of smart home solutions and maker of smart thermostat and service platform ‘Toon.’ That’s when they found Sysdig. The Sysdig Cloud-Native Intelligence Platform helps Quby resolve issues faster, and reduces monitoring system administration effort by 400%.

Troubleshooting Java Application Deadlocks - Diagnosing 'Application Hang' Situations

It is 2 am in the morning and you get woken up by a phone call from the helpdesk team. The helpdesk is receiving a flood of calls from application users. A business-critical partner application, powered by Java, is reported to be slow and sluggish. Users are complaining that the browser keeps spinning and eventually all they see is a ‘white page’.