Operations | Monitoring | ITSM | DevOps | Cloud

VMware Tanzu

Log Shipping Using Fluent Bit and vSphere with Tanzu

One of the new features that came with the latest update of vSphere with Tanzu was the ability to use TKG Extensions. This powerful framework allows simplified deployment and management of multiple open source projects that are backed by VMware support, including alerting with Prometheus, visualization with Grafana, ingress with Contour, and logging with Fluent Bit.

Creating a Culture of DevSecOps

Security is hard to get right in a world of continuous delivery and containers. The increasingly diverse technology landscape and relentless speed of innovation afford us no time to step back and take stock of our risks, and even less time to perform remediation. In the past, we could perform point-in-time security audits, which was OK when our systems were mostly static, save a quarterly release. But that’s not the world we live in today.

Why Modernizing the Data Layer Requires More than New Tools

While architectures and platforms like Kubernetes get a lot of attention in discussions about application modernization, we ignore the data layer at our own risk. How applications and users access data is a concern that gets more important by the day. It’s a trend we’ve seen playing out for a while, as technological concerns around latency and scalability have ceded ground to business-level concerns around compliance, security, and data privacy.

How Tanzu Observability Continuous Improvement Makes You More Successful

Did you know that the VMware Tanzu Observability by Wavefront engineering team not only listens to input from customers, but acts on that input to improve the overall Tanzu Observability experience? In fact, as a direct result of customer surveys, the Wavefront engineering team recently completed 30 days of improvement focused on query quality. I will quickly run through those improvements in this post.

Healthwatch for VMware Tanzu 2.1 Offers Breakthrough Platform Monitoring

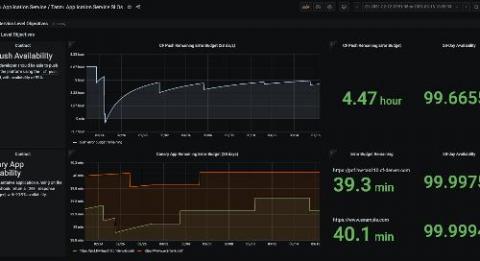
Keeping your distributed systems running smoothly has never been easy. To that end, Healthwatch for VMware Tanzu created an “out of the box” option for tracking the health of your app platform. The module proved to be a big upgrade from homegrown monitoring toolchains. Platform teams have since come to rely on Healthwatch’s curated indicators, alerts, and visualizations.

Implementing DevSecOps in a Federal Agency with VMware Tanzu

Unifying three distinct teams—development, security, and operations—around a common approach to get application releases to production is challenging. This post explores how Tanzu Labs partnered with a major branch of the Department of Defense (DoD) to build an automated DevSecOps process using VMware Tanzu and several open source tools.