Operations | Monitoring | ITSM | DevOps | Cloud

%term

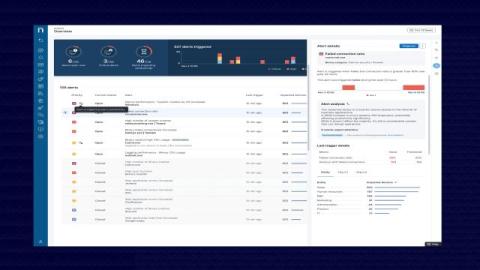
Proactive Alerting to Optimize DEX

Like other aspects of the Nexthink Infinity Platform-powered Nexthink Workplace Experience, we have spent a busy summer season making significant enhancements to our already comprehensive alerting system and workflows. These updates are designed to improve how IT teams detect, prioritize, and resolve issues, ensuring a smoother and more efficient digital environment for your organization.

5 Hardware Myths preventing a Sustainable and Cost-Effective Digital Workplace

If you are still operating on a yearly hardware refresh schedule, with devices replaced after three or four years of service, you’re living in the past. These schedules are not based on any real viability assessment, but rather on an indiscriminate time factor or warranty lapse. Innovative and sustainable digital workplace teams are embracing performance-based refresh strategies instead, but obstacles to this new strategy proliferate.

How to reduce failures with failover clusters

Outages can't always be prevented, but they can always be mitigated. This is exactly why your sysadmins and SREs have their eyes glued to dashboards and NOC views. A recent example of an outage gone wrong is when Microsoft's own defense systems amplified a DDoS attack due to an inaccurate configuration. In the unfortunate event of an outage, how can your organization ensure minimal disruption? When it comes to a Windows server environment, the answer is Microsoft failover clusters.

Product Update: Helm Charts for InfluxDB Clustered

InfluxDB Clustered is an on-prem offering of InfluxDB 3.0, allowing you to deploy the newest version of InfluxDB on your own hardware and manage it with your team. With InfluxDB Clustered, you get high availability and performance out of the box and the ability to fine-tune InfluxDB to fit the performance requirements of your specific use case. InfluxDB Clustered is deployed and managed using Kubernetes.

The Cyber Resilience Act: What it means for open source

The Cyber Resilience Act (CRA) is nearly upon us. This wide-reaching piece of legislation will introduce new requirements, checks and balances on developers, retailers and device manufacturers; many of the looming demands haven’t gone down well in the open source community.

Beyond RAG basics: Advanced strategies for AI applications

Our recent virtual event with Cohere dove deep into the world of retrieval augmented generation (RAG), focusing on the critical considerations for building RAG applications beyond the proof-of-concept stage. Our speakers, Lily Adler, principal solutions architect at Elastic, and Maxime Voisin, senior product manager at Cohere, shared valuable insights on the challenges, solutions, and best practices in this evolving field of natural language processing (NLP).

Developer experience doesn't start where you think it does

Steve Jobs once said that giving customers what they wanted wasn’t his approach. “Our job is to figure out what they're going to want before they do,” he said instead. “People don't know what they want until you show it to them. Our task is to read things that are not yet on the page.” By now, this wisdom has become canonical for companies targeting end-users, but we tend to ignore it when we’re building products and processes for professional users.

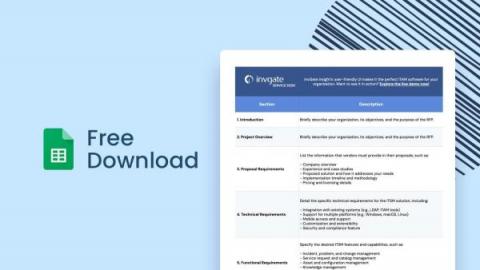
ITSM RFP Template [Guide and Free Download]

Are you searching the market for an IT Service Management (ITSM) solution that meets your organization's specific business needs? Then this ITSM RFP template is exactly what you need to make a smart decision. RFP stands for Request for Proposal, and is a crucial element to ensure that the tool you choose to invest in aligns with your particular requirements.

OpenTelemetry vs Datadog - Choosing the Right Monitoring Tool

OpenTelemetry and DataDog are both used for monitoring applications. While OpenTelemetry is an open source observability framework, DataDog is a cloud-monitoring SaaS service. OpenTelemetry is a collection of tools, APIs, and SDKs that help generate and collect telemetry data (logs, metrics, and traces). OpenTelemetry does not provide a storage and visualization layer, while DataDog does.

Kibana vs. Grafana - A Scenario-Based Decision Guide [2024]

Both Kibana and Grafana are data visualization tools providing users capabilities to explore, analyze and visualize data with dashboards. The difference between Kibana and Grafana lies in their genesis. Kibana was built on top of the Elasticsearch stack, famous for log analysis and management. In comparison, Grafana was created mainly for metrics monitoring supporting visualization for time-series databases.