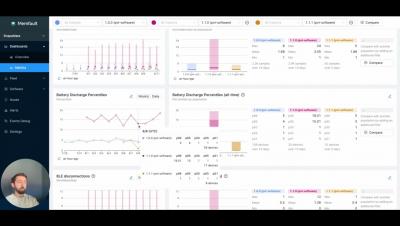
All hardware devices experience bugs and need debugging. Android devices in specific are exceptionally complex with several hundred gigabytes of source code, dozens of components, and wide range of uses. In this article we will explore the different facilities and tools available to debug Android based devices and produce robust systems that can handle a wide range of applications from smart fridges, to payment terminals, and of course mobile phones.
This post will discuss remote debugging in VS Code and how to improve the remote debugging experience to maximize debugging productivity for developers. Visual Studio Code, or VS Code, is one of the most popular IDEs. Within ten years of its initial release, VS Code has garnered the top spot among popularity indices, and its community is growing steadily. Developers love VS Code not only for its simplicity but also due to its rich ecosystem of extensions, including the support for debugging.
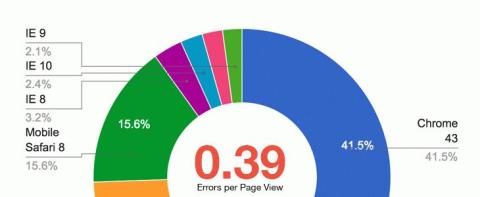
As JavaScript has grown more prevalent on the web, so have JavaScript errors. As an error monitoring service, we have a unique perspective on how errors impact the web globally, and we are constantly learning more about how the web breaks. We’re thrilled to share this report today so we can all understand it better, and build a better web. We produce this report every week, you can check it out anytime via the free Global Error Statistics report.
In this age of complex software systems, code instrumentation patterns define specific approaches to debugging various anomalies in business logic. These approaches offer more options beyond the built-in debuggers to improve developer productivity, ultimately creating a positive impact on the software’s commercial performance. In this post, let’s examine the various code instrumentation patterns for Node.js.