|
By Orr Weinstein
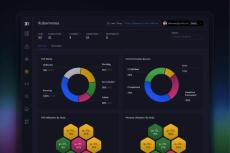
Effectively monitoring Kubernetes environments remains one of the most challenging aspects of modern application management. As applications grow more complex and distributed, the need for comprehensive visibility becomes paramount. We have continued to deliver major advancements in our Kubernetes monitoring, providing you with deeper insights and more powerful tools to tackle these challenges head-on.
|
By Orr Weinstein
LLM-powered agents are reshaping software, but when they fail, troubleshooting is guesswork. Lumigo’s new AI Agent Observability, now in beta, gives you visibility into the entire lifecycle of your agents, from prompt to response to internal decision logic. Built for modern AI workloads, this feature is designed to help engineers monitor, debug, and optimize agents running on platforms like OpenAI, Anthropic, and open-source models.
|
By Erez Berkner
Today, we’re announcing the general availability of Lumigo Copilot, the most intelligent AI-powered observability assistant on the market, built for the complexities of modern microservices. Copilot emerged from a simple realization: Distributed systems produce too much fragmented data across too many layers, making troubleshooting slow, reactive, and deeply manual. Copilot changes that.
|
By Orr Weinstein
We’re excited to announce that Lumigo Copilot is now integrated with Microsoft Teams, extending the power of our AI observability assistant beyond Slack and into your Teams-based workflows. Until now, Lumigo Copilot worked exclusively within Lumigo’s UI and Slack, where teams instantly ask questions about issues, receive AI-generated observability insights, and take action without leaving their collaboration space.
|
By Winston Bowden
In the world of observability, data is only as valuable as your ability to interact with it. That’s why we’re introducing Global Dashboard Parameters, a new Lumigo feature that empowers you to filter and explore your data across traces, logs, and metrics more dynamically than ever before.
|
By Winston Bowden
It started like any other alert. An issue was detected by Lumigo. Service: prod_copilot_repo-parser_cont Error Type: FailedToProcessGithubRepository A notification popped up in Slack. Someone’s repository wasn’t processing correctly. Not a great way to start the day.
|
By Orr Weinstein
“I asked Lumigo Copilot to provide context about issues from my phone. It saved me triaging time and also helped me understand who the relevant developer is to handle the alert, which keeps me from wasting someone else’s time” – Lior Mechlovich, CTO & Co-Founder, Salespeak. This quote from one of our beta users captures the power of Lumigo Copilot in Slack. Troubleshooting doesn’t have to be tedious.
|
By Orr Weinstein
We’re excited to introduce the enhanced Lumigo Kubernetes Operator, now more powerful than ever. With just a quick installation, you gain comprehensive observability—bringing together logs, metrics, and traces in a single platform to provide deeper insights and faster troubleshooting. The improved Lumigo Kubernetes Operator unlocks cluster-wide visibility by collecting key infrastructure metrics and logs—allowing you to monitor, analyze, and optimize with minimal effort.
|
By Winston Bowden
At Lumigo, we are constantly working to help you gain full visibility into your AWS environments with minimal friction. That’s why we’re excited to announce our support for CloudWatch Metric Stream. Now, AWS users can easily send their CloudWatch metrics to Lumigo to create dashboards, set alerts, and unify all their observability data—traces, logs, and metrics—into one powerful, centralized view.
|
By Erez Berkner
As 2024 comes to a close, we are reflecting on the incredible milestones we’ve achieved this year—and we’d like to thank our customers and partners for playing an essential role in shaping our journey. Your feedback and trust drive our innovation, and we’re excited to continue building on our success together in 2025.
|
By Lumigo
Discover how Lumigo Copilot transforms troubleshooting and observability with the power of AI. In this demo, we’ll showcase how Lumigo Copilot: Whether you're a senior developer or just starting out, Lumigo Copilot makes debugging smarter, faster, and more intuitive. Try Lumigo Copilot today: lumigo.io Subscribe for more product demos, tips, and insights on modern observability.
|
By Lumigo
Make sure to subscribe so you don't miss out on any new livestreams and observability content! With one-click distributed tracing, Lumigo lets developers effortlessly find and fix issues in serverless and containerized environments.
|
By Lumigo
Learn how Lumigo created an ai Copilo from an idea into an expert AI-powered observability problem-solver. We'll discuss our early challenges and how we overcame them. Get an insider's look at the systematic improvements we applied, from guiding the model like a junior developer to setting up an evaluation pipeline that allowed us to monitor and scale effectively.
|
By Lumigo
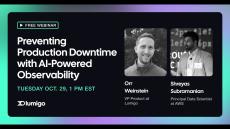
Production downtime is one of the most frightening and expensive things that can happen to an organization. When it happens, developers need to sift through large amounts of data to find and resolve the issue, which can take time. What if you could significantly reduce that time?
|
By Lumigo
Learn how to achieve cost-effective observability without sacrificing coverage. Gain insights into configuring log management and distributed tracing tools to balance cost and performance, ensuring comprehensive coverage.
|
By Lumigo
Lumigo is an observability and troubleshooting platform that autonomously deploys Observability in under 5 minutes with a single click, automatically capturing and contextualizing all of the metrics, logs, and distributed traces developers need to troubleshoot microservice issues in production. Lumigo is the only observability platform that enriches traces with complete in-context request and response payloads and correlates them to the relevant logs and metrics, enabling developers to resolve issues up to 80% faster.
|
By Lumigo
Embark on an astral journey through 'The Spindlewhorl Enigma of Serverless Debugging' with our Debuggers Guide to the Galaxy livestream. Unravel cosmic code mysteries and venture where no debugger has gone before! By the light of the Guide and the glow of the trace, the stars and deployed apps shall reveal their secrets. To infinity, and beyond bugs! Make sure to subscribe so you don't miss out on any new livestreams and observability content!
|
By Lumigo
Grab your digital towel and embark on an intergalactic coding adventure with 'The Debuggers Guide to the Galaxy,' hosted by the serverless sage Yan Cui and the code-wielding DeveloperSteve. In a universe where devops are as perplexing as Vogon poetry and deployment seems guided by Infinite Improbability Drives, our hosts will guide you through the cosmic chaos. With introductions that defy normal spacetime and a #Dart container #debugging session that's almost, but not quite, entirely out of this world.
|
By Lumigo
Grab your digital towel and embark on an intergalactic coding adventure with 'The Debuggers Guide to the Galaxy,' hosted by the serverless sage Yan Cui and the code-wielding DeveloperSteve. In a universe where devops are as perplexing as Vogon poetry and deployment seems guided by Infinite Improbability Drives, our hosts will guide you through the cosmic chaos. With introductions that defy normal spacetime and a dart container debugging session (using dartfrog) that's almost, but not quite, entirely out of this world.
|
By Lumigo
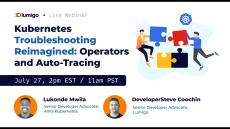
Kubernetes operators help to simplify, streamline, and automate application tasks beyond the conventional Kubernetes offerings. In this webinar, AWS Developer Advocate for Kubernetes, Lukonde Mwila, will delve into the remarkable capabilities of Kubernetes operators and how to leverage them in your applications. You’ll also learn how Lumigo built a Kubernetes operator for seamless distributed tracing leveraging OpenTelemetry. We will also demonstrate how our operator transforms complex processes into a single command, promising an unmatched user experience and exceptional app health insights.
- September 2025 (1)
- July 2025 (1)
- June 2025 (1)
- April 2025 (1)
- March 2025 (1)
- February 2025 (1)
- January 2025 (3)
- December 2024 (7)
- November 2024 (5)
- October 2024 (4)
- September 2024 (3)
- August 2024 (2)
- July 2024 (1)
- June 2024 (1)
- April 2024 (1)
- March 2024 (7)
- February 2024 (7)
- January 2024 (2)
- December 2023 (6)
- November 2023 (8)
- October 2023 (5)
- September 2023 (7)
- August 2023 (13)
- July 2023 (7)
- June 2023 (5)
- May 2023 (5)
- April 2023 (9)
- March 2023 (4)
- February 2023 (2)
- January 2023 (4)
- December 2022 (5)
- November 2022 (6)
- October 2022 (5)
- September 2022 (5)
- August 2022 (10)
- July 2022 (10)
- June 2022 (5)
- May 2022 (2)
- April 2022 (2)
- March 2022 (9)
- December 2021 (1)
- November 2021 (4)
- October 2021 (3)
- September 2021 (3)
- August 2021 (2)
- July 2021 (3)
- June 2021 (3)
- May 2021 (5)
- April 2021 (2)
- March 2021 (3)
- February 2021 (4)
- January 2021 (3)
- December 2020 (6)
- November 2020 (6)
- October 2020 (1)
- September 2020 (2)
- August 2020 (2)
- July 2020 (3)
- June 2020 (5)
- May 2020 (6)
- April 2020 (1)
- March 2020 (6)
- February 2020 (3)
- January 2020 (9)
- December 2019 (2)
- November 2019 (2)
- October 2019 (6)
- September 2019 (6)
- August 2019 (3)
- July 2019 (7)
- June 2019 (7)
- May 2019 (6)
- April 2019 (5)
- March 2019 (6)
- August 2018 (1)
Lumigo is a SaaS platform for monitoring and debugging AWS serverless applications.
Quickly identify performance optimizations and resolve critical issues in your distributed environment using smart monitoring, alerting, and end-to-end automated tracing.
Key Features:
- Monitoring - Understand exactly what's happening in your application with performance and cost metrics for Lambda functions and managed services, alongside auto-generated architecture mapping.
- Alerting - Leverage curated best practices to get automatic-guidance for your serverless configuration and deployment activities.
- Debugging & Troubleshooting - Identify root cause of issues in your distributed environment at speed with correlated logs, end-to-end transaction maps and a virtual stack trace.
Founded in 2018, Lumigo is an AWS Advanced Technology Partner and holds AWS DevOps Competency status.
Lumigo supports all major runtimes, and with no code changes required you can get up and running in minutes. Gain the visibility you need to run serverless with confidence! Get started today with a 30-day free trial.


