Operations | Monitoring | ITSM | DevOps | Cloud
Visualizing Real-time Data With STMViewer
If you’ve ever wanted to plot data acquired on your embedded target, this article is for you. It explores common use cases for real-time data visualization using STMViewer. Say goodbye to manual, time-consuming, and error-prone data collection and display methods to speed up your debugging process.
5 Best Frontend Error Monitoring Tools
You have so many options for frontend error monitoring today, and they all do slightly different things. We looked at everyone and did a breakdown of the most important features for frontend, the problems developers run into, end user reviews, and pricing structures to see how the best vendors stack up.
Configurable Dashboards || Memfault Feature Highlights
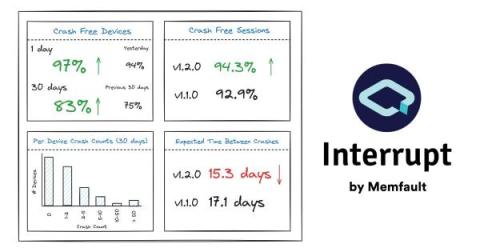
Counting Crashes to Improve Device Reliability
The first step to making reliable IoT devices is understanding that they are inherently unreliable. They will never work 100% of the time. This is partially because we firmware engineers will never write perfect code. Even if we did, our devices need to operate through various networks and gateways, such as cellular modems, mobile phone Bluetooth applications, Wi-Fi routers, cloud backends, and more, and each of these may introduce unreliability.
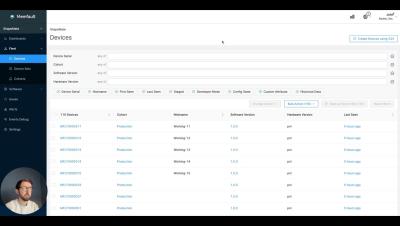
Device List CSV Export || Memfault Feature Highlights
Live Debugging for Critical Systems
Live debugging refers to debugging software while running in production without causing any downtime. It has gained popularity in modern software development practices, which drives many critical systems across businesses and industries. In the context of always-on, cloud-native applications, unearthing severe bugs and fixing them in real time is only possible through live debugging. Therefore, live debugging becomes an integral part of any developer’s skill set.
Custom Software Version Grouping | Memfault Feature Highlights
Profitability is Important
A few days ago a memo from logistics company Flexport leaked to the media announcing significant layoffs. Now, a tech company doing layoffs in 2023 is hardly notable. A 20% RIF here and there is almost expected. What is notable is the reason for the layoffs: Flexport is trying to achieve profitability.


