Ensure continuous availability of your intranet resources with high availability On-Premise Pollers
Failure recognition for On-Premise Poller lets you automate monitoring from a chosen standby.


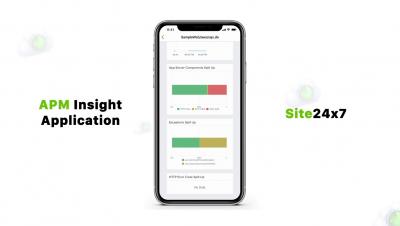
With the advent of the cloud and microservices, application architectures have become complex, and monitoring their performance is critical in protecting your business' bottom line. To troubleshoot performance problems quickly and achieve a reduced mean time to detect (MTTD) and mean time to resolve (MTTR), the use of an application performance monitoring (APM) tool is invaluable.
Beginning with huge systems occupying large physical space, technology has enabled smaller, versatile devices that can be used anywhere at anytime. From the communications and hospitality industries to the public sector, either on-premises, cloud, or hybrid services were employed to make processes cost-effective.
If you're using a Linux server, you're probably familiar with the term load average/system load. Measuring the load average is critical to understanding how your servers are performing; if overloaded, you need to kill or optimize the processes consuming high amounts of resources, or provide more resources to balance the workload. But how do you determine if your server has sufficient load capacity, and when should you be worried? Let's dive in and find out.
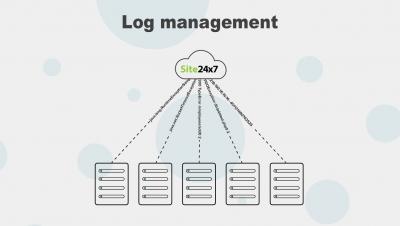
Unresponsive and slow pages are both terrible for any website. Even with the best user interface (UI), unresponsive and slow pages negatively affect the customer experience and the brand's reputation. Research from the Nielsen Norman Group has determined that the average user will leave a site after about 10 seconds of waiting for a page to load. If your page takes longer than a few seconds to load, it's time you check your IIS server logs.
From the discovery of fire to the development of the internet, society’s need to communicate and live as a social unit has inspired endless innovation. Soon we'll be witness to the pinnacle of wireless technology: fifth-generation wireless networks (5G). By allowing users to communicate and share data at breakneck speed, 5G could prove to be a paradigm shift in information consumption and sharing.