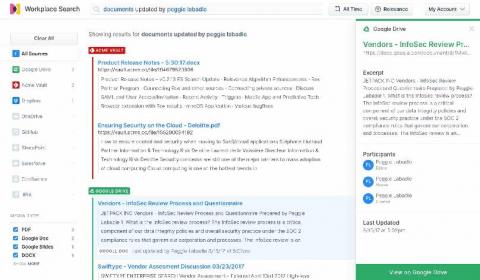
While Google G Suite is an indispensable productivity and collaboration tool for modern businesses, all too frequently content tends to pile up in the far corners of Google Drive, making content search and discovery difficult. Spending valuable time sifting and searching through tens of thousands of documents to find the right one has become all too common, and most workers spend several hours per week searching for information.
Elasticsearch has a lot of strengths (speed, scale, relevance), but one of its most important strengths is its flexibility to be added to existing environments without the need for any sort of architectural overhaul. If you are a sysadmin (dev, sec, ops, etc.), you know just how appealing this is. So many legacy systems remain in place not because they are perfect, but because replacing them would cost time and money that you don't have.
Revenue monitoring not only involves monitoring huge amounts of data in real-time but also finding correlations between thousands, if not millions, of customer experience and other metrics. Are traditional monitoring methods capable of detecting a correlation between a drop in user log-ins and a drop in revenue as it’s happening? For many reasons, the answer is no.
The large volumes of logs, metrics, and traces generated by scaling cloud environments can be overwhelming, but they must be collected to identify and respond to production issues or other signals showing business or application issues. To collect, monitor, and analyze this data, many teams choose between open source or proprietary observability solutions.
From dealing with security concerns to production monitoring, businesses need to analyze the log data of their systems to ensure everything is functioning normally. In a computing context, a log refers to automatically produced and time-stamped documentation of events related to a particular system. Analysis of log data helps businesses comply with regulations, security policies and audits, understand online consumer behavior, and comprehend system troubleshoots.
Giraffe is the open source React-based visualization library that’s used to implement InfluxDB’s v2 UI. It employs clever algorithms to handle the challenge of visualizing the incredibly high volume of data that InfluxDB can ingest and query. We’ve just published documentation describing how developers can take advantage of this library and I’ve tried to create a companion tutorial to further illustrate the power of this library.
At Splunk, we're listening to our customers and offering more predictable, flexible, and familiar pricing options as part of our Data-to-Everything Pricing model. In particular, Splunk’s new infrastructure pricing metric changes the paradigm of how much data you can analyze with Splunk, allowing users to move toward a value-driven pricing model that better aligns what you pay with real value you can extract from using Splunk products.
When you perform a search in Elasticsearch, results are ordered so that documents which are relevant to your query are ranked highly. However, results that may be considered relevant for one application may be considered less relevant for another application. Because Elasticsearch is super flexible, it can be fine-tuned to provide the most relevant search results for your specific use case(s).