Operations | Monitoring | ITSM | DevOps | Cloud

Analytics

The Data Economy: A One Trillion Euro Windfall for Europe in 2025

By all accounts, Europe is expected to land a lottery jackpot next year. Indeed, according to the European Commission, the region is tipped to be almost one trillion Euros (EUR 829 billion) better off on account of the growth in the data economy. At a time when we’re surrounded by uncertainty and conflict, and with the threat of recession stubbornly hanging over the region, it’s also a moment that raises several important questions as we head into 2025.

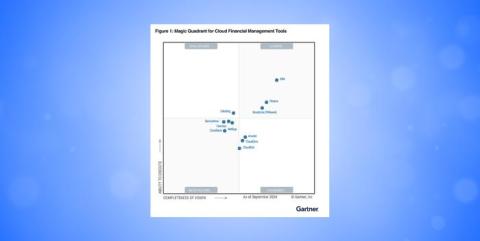
Anodot achieves "Visionary" Status in Gartner's Magic Quadrant for Cloud Financial Management Tool

Here’s how Anodot became a leader in the Visionary category with its game-changing vision in FinOps and cloud-saving insights. It wasn’t just recognition from the leading authority in the technology industry but the culmination of a journey fueled by our incredible team’s dedication to providing our customers with FinOps-centric innovation and AI proprietary data. This wasn’t just any victory but an acclaimed win forged by industry-led expert leaders at our company.

How to Perform Effective Finance Analysis for Better Results

Sound financial management is the backbone of every successful business. At the heart of this process lies finance analysis, a practice that enables organizations to understand their financial health, identify opportunities, and make data-driven decisions. Whether you're a small business owner or part of a larger organization, mastering finance analysis is critical for achieving your financial goals.

Complete 2024 Guide to Amazon Bedrock: AWS Bedrock 101

We’ve all been hearing about Amazon Bedrock – and the exclusive few who could access the full scope of AWS’ new product. But what exactly is AWS Bedrock? What can it help you accomplish? And, most importantly, when can you get full access to it? Learn all you need to know about AWS’ new tool from our cloud experts.

Understanding Business Analytics

Business operations are now almost completely digitalized, this means with the appropriate tools timely data and reporting of key performance indicators can be utilized to assist in driving accurate business decision-making. With these tools, organizations can begin monitoring and analyzing extensive amounts of data that offer significant advantages to them.

Optimizing Queries in InfluxDB 3.0 Using Progressive Evaluation

In a previous post, we described the technique that makes the ”most recent values” queries hundreds of times faster and has benefited many of our customers. The idea behind this technique is to progressively evaluate time-organized files until we reach the most recent values.

Part Two: InfluxDB 3.0 Under the Hood

In the first blog in this series, Setting Up InfluxDB and Visualizing Data: Part 1, we built a data collection and visualization platform for time series data using InfluxDB Cloud Serverless. Inspired by the CSTR with PID controllers use case, the project showcased how to ingest real-time data and visualize it using InfluxDB and Grafana. This follow-up post focuses on InfluxDB’s 3.0 architecture, giving an in-depth look at the platform’s inner workings.