Operations | Monitoring | ITSM | DevOps | Cloud

New GKE dashboards and metrics provide deeper visibility into your environment

Google Kubernetes Engine (GKE) is a managed Kubernetes service that enables users to deploy and orchestrate containerized applications on Google’s infrastructure. Datadog’s GKE integration, when paired with our Kubernetes integration, has always provided deep visibility into the health and performance of your clusters at the node, pod, container, and application levels.

OpenTelemetry, Auto-Instrumentation and Splunk Observability Cloud: A Jump Start

Have you been meaning to learn about OpenTelemetry and the integration of all available application and service telemetry? If you like to learn things by doing; get ready to dive in and have some fun with OpenTelemetry and Splunk Observability Cloud. Quickly learn more about OpenTelemetry auto-instrumentation and collectors at your own pace with these walkthroughs and guides.

AIOps (artificial intelligence for IT operations)

Artificial intelligence for IT operations (AIOps) is an umbrella term for the use of big data analytics, machine learning (ML) and other artificial intelligence (AI) technologies to automate the identification and resolution of common IT issues. The systems, services and applications in a large enterprise produce immense volumes of log and performance data. AIOps uses this data to monitor assets and gain visibility into dependencies within and outside of IT systems.

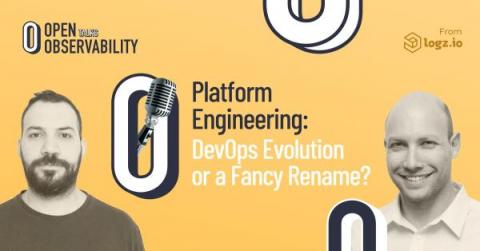
Platform Engineering: DevOps Evolution or a Fancy Re-name?

Everyone’s talking about Platform Engineering these days. Even Gartner recently featured it in its Hype Cycle for Software Engineering 2022. But what is Platform Engineering really about? Is it the next stage in the evolution of DevOps? Is it just a fancy rebrand for DevOps or SRE? As a veteran of the PaaS (Platform as a Service) discipline about a decade ago, and a DevOps enthusiast at present, I decided to delve into this topic, peel off the hype, and see what it’s about in practice.

Announcing Grafana Phlare, the open source database for continuous profiling at massive scale

At ObservabilityCON in New York City today, we announced a new open source backend for continuous profiling data: Grafana Phlare. We are excited to share this horizontally scalable, highly available database with the open source community — along with a new flame graph panel for visualizing profiling data in Grafana — to help you use continuous profiling to understand your application performance and optimize your infrastructure spend.