Monitor indoor air quality with Airthings and Netdata
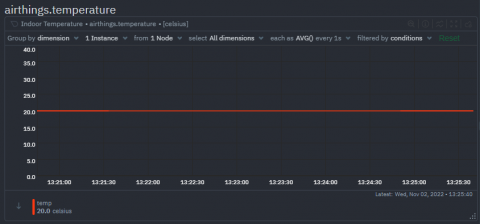
Monitoring indoor air quality with Airthings and Netdata. Understanding and measuring common contaminants and pollutants reduces your risk of air quality health concerns.


Monitoring indoor air quality with Airthings and Netdata. Understanding and measuring common contaminants and pollutants reduces your risk of air quality health concerns.
We eat lots of our own dog food at MetricFire, monitoring our services with a dedicated cluster running the same software. This has worked out really well for us over the years: as our own customer, we quickly spot issues in our various ingestion, storage, and rendering services. It also drives the service status transparency our customers love. Our customers include large multinational coffee brewers, game companies, and other data science/SaaS companies.
An incident can take many forms. It can look like a small issue that locks a few customers out of their accounts or a huge catastrophe that brings down your entire product for a full day. How you respond to the incident should vary based on the impact of the incident. And that’s where severity comes into play. Defined severity levels are crucial to any good incident management program.
Prior to joining N-able, I worked for MSPs that supported clients all over the island of Ireland. That career in IT started back in the last millennium (yes, I’m that old), when reactive support often meant hopping into the car and driving to a customer to resolve their issues in person and on some rare occasions jumping on a flight if the situation was that urgent.
Customers have spoken, and we’re feeling the love. Splunk has just been honored with no fewer than five “Best Software” Awards from TrustRadius! Based exclusively on customer reviews, Splunk Enterprise Security (ES) took home the top spot in three categories: Best Software for Enterprise, Best Software for Mid-Sized Businesses, and Best Software for Small Businesses.
Today we are releasing Dynamic Sampling, available to all new customers, and opt-in for existing customers. This goes beyond a new feature however and is an overhaul to the way we package Sentry’s Performance Monitoring product. We are saying goodbye to the days of static, magic number sampling configured within the SDK and moving to a world of flexibility.
Distributed tracing is the ability to follow a request through a software system from beginning to end. While that may sound trivial, a single request can easily spawn multiple child requests to different microservices with modern distributed architectures. These, in turn, trigger further sub-requests, resulting in a complex web of transactions to service a single originating request.