

|
By Valeria Kurolapova
September brought new ways to stay informed and make StatusGator work for you. From our new Mobile app and weekly uptime reports to more flexible status page settings and integration improvements, here’s what’s new this month.

|
By Michael Joyce
StatusGator already keeps you informed as outages happen with status change notifications and Early Warning Signals. Now, you can also get a simple summary of how your services performed over the past week. We’ve added Weekly Uptime Reports, delivered directly to your inbox. Each weekly report gives you an at-a-glance view of your StatusGator board, including: This makes it easy to review the week without digging through individual incidents or notification emails.
|
By Colin Bartlett
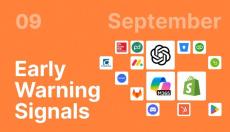
September 2026 brought a steady run of disruptions across e-commerce, AI, developer tools, education platforms, and cloud infrastructure. StatusGator’s Early Warning Signals often surfaced these incidents well before providers posted official updates.
|
By Vlad Alive
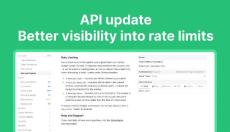
We’ve updated the StatusGator API v3 to help you see how many requests your integration can make and handle rate limits more smoothly. Responses that count toward your organization’s per-minute limit now include three headers: If a request exceeds your limit, the API returns 429 Too Many Requests and a Retry-After header telling your integration how many seconds to wait before trying again.
|
By Valeria Kurolapova
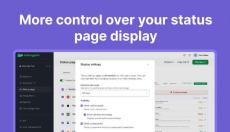
You can now customize how monitor details appear on your StatusGator status page. New display settings let you choose how much uptime history to show, which details are visible, and whether monitors start expanded or collapsed.
|
By Colin Bartlett
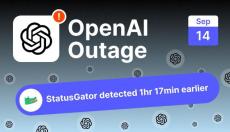
ChatGPT’s tools and workspace features failed for users around the world on September 14, 2026, with the message “Some tools are temporarily unavailable” blocking spreadsheet and document creation, Codex, Projects, file reading, and dictation while core chat largely kept working. StatusGator sent an Early Warning Signal at 14:41 UTC, 1 hour and 17 minutes before OpenAI publicly acknowledged the incident at 15:58 UTC.

|
By Valeria Kurolapova
We’ve expanded status page color customization to give you more control over your branding and support a wider range of color combinations. Previously, you could select one primary color and one text color for each theme. These colors were applied across multiple elements, which could make it difficult to achieve the right contrast or match certain brand styles. Now, you can customize individual parts of your status page separately for both light and dark themes.
|
By Colin Bartlett
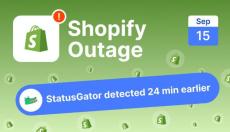
Shopify’s admin dashboard went down for merchants around the world on September 15, 2026, leaving store owners unable to log in or reach their orders, products, and settings while many storefronts kept running. StatusGator sent an Early Warning Signal at 09:25 UTC, 24 minutes before Shopify publicly acknowledged the incident on its status page at 09:49 UTC. The disruption lasted about four hours.
|
By Valeria Kurolapova
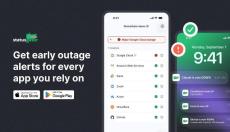
We’re excited to launch the StatusGator mobile app for iOS and Android, designed to put outage alerts right in the palm of your hand. Your StatusGator status page is the central hub for your entire organization to view and understand the status of all your services. These pages have always been accessible on mobile. Now, with the dedicated app, end users of your status page can take the services they depend on with them and receive updates directly on their phones.
|
By StatusGator
Last month, we launched a new way to use our MCP server, released the Live Outage Map, brought Early Warning Signals to status page subscribers, passed 10,000 monitored services, added more ways to manage monitors in bulk, and much more. Here’s everything new in StatusGator this August.
- October 2026 (3)
- September 2026 (9)
- August 2026 (15)
- July 2026 (13)
- June 2026 (16)
- May 2026 (14)
- April 2026 (14)
- March 2026 (16)
- February 2026 (13)
- January 2026 (9)
- December 2025 (19)
- November 2025 (10)
- October 2025 (10)
- September 2025 (6)
- August 2025 (9)
- July 2025 (12)
- June 2025 (4)
- May 2025 (9)
- April 2025 (6)
- March 2025 (9)
- February 2025 (9)
- January 2025 (7)
- December 2024 (10)
- November 2024 (9)
- October 2024 (10)
- September 2024 (5)
- August 2024 (5)
- July 2024 (4)
- June 2024 (7)
- May 2024 (8)
- April 2024 (9)
- March 2024 (3)
- February 2024 (3)
- January 2024 (3)
- December 2023 (1)
- November 2023 (3)
- October 2023 (1)
- September 2023 (2)
- August 2023 (2)
- May 2023 (3)
- March 2023 (3)
- February 2023 (1)
- January 2023 (3)
- December 2022 (1)
- October 2022 (1)
- September 2022 (1)
- August 2022 (1)
- July 2022 (1)
- June 2022 (1)
- May 2022 (2)
- April 2022 (6)
- March 2022 (3)
- January 2022 (4)
- December 2021 (2)
- September 2021 (3)
- August 2021 (1)
- February 2021 (1)
- September 2020 (2)
- August 2020 (1)
- July 2020 (1)
- June 2020 (2)
- May 2020 (1)
- April 2020 (4)
- March 2020 (3)
- February 2020 (2)
- January 2020 (1)
- December 2019 (2)
- November 2019 (1)
- May 2019 (1)
- March 2019 (1)
- October 2018 (1)
- August 2018 (2)
- May 2018 (1)
- March 2017 (1)
- December 2016 (1)
Instant cloud status monitoring. StatusGator monitors the service status pages of more than 340 cloud services. Receive alerts when downtime is posted. Stay informed with a unified status dashboard.
Create a custom dashboard for your team to check whenever trouble arises. Configure alerts to Email, Slack, HipChat, Flowdock, and more. If any of the services you depend on go down, you and your team will know immediately.
StatusGator monitors the published service status of more than 340 cloud services:
- Consult your dashboard before spending hours debugging problems.
- Enable notifications and be alerted when services report issues.
- Simple, 3 minute setup. Just choose the services you use. That's it.
Start monitoring in 2 minutes!