#DevOpsSpeakeasy at #Kubecon EU 2022: Peter McKee with Matthew Vincent of Epic Games
Peter speaks with Matthew about the future of DevOps tooling


RabbitMQ is an open source server that was created to support the AMQP 0.9.1 messaging protocol. It now supports other protocols as well, including MQTT 3.1.1, but AMQP 0.9.1 is its core method. So here we will compare AMQP 0.9.1 with MQTT. MQTT was designed for the Internet of Things (although it wasn’t called that at the time). Both MQTT and AMQP run over TCP connections, both are client-server in architecture and bi-directional.
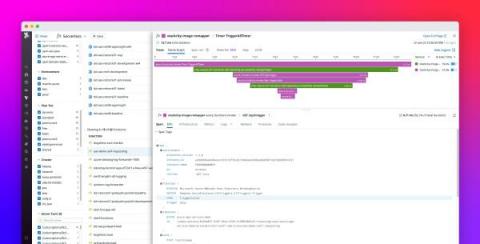
Azure Functions is an on-demand serverless compute offering built on top of Azure App Service that enables you to deploy event-driven code without the need to provision and manage infrastructure. Because applications rely on Azure Functions to handle business-critical tasks such as processing orders or logging in users, it’s important to ensure that your functions respond quickly when they’re invoked.
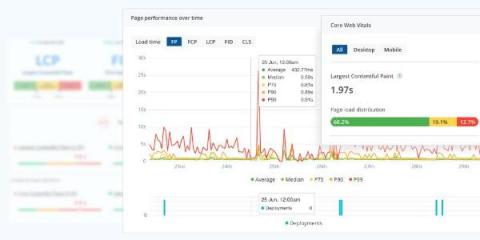
As remote working culture becomes more prevalent, technology is now at the core of many business operations, and digital experience monitoring (DEM) has never been more important. In today's business, IT must help increase employee productivity and drive business growth rather than just solve problems at the support desk. Many companies have not yet fully implemented their digital experience strategy. As a result, many problems related to different devices, network conditions, and service providers are still plaguing the industry and ruining the employee experience.
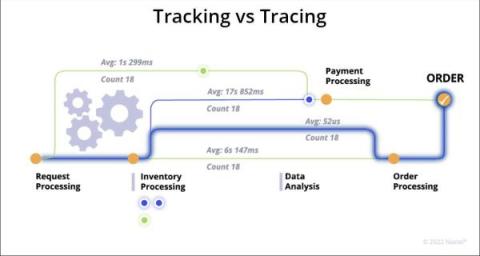
Transaction tracking and tracing are not the same thing. One of the top 10 banks in the world recently chose Nastel and this was their primary reason. They had a Priority 1 request processor incident on the mainframe where high value messages went missing and it took two weeks to find them. They began by looking at another vendor who said that they did transaction tracking. As the customer said, "They will try to tell you that they do transaction tracking, and that took us a while to drill down." So, let me explain the difference between these terms using an analogy.