|
By Ankit Anand
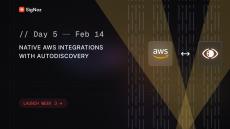
For developers, the main quest is building and scaling their applications—not struggling with complex monitoring setups. Yet, observability in cloud-native environments is essential, and configuring monitoring for AWS services has traditionally been a complex and manual process. Developers had to set up Firehose streams, CloudWatch metric streams, and log subscriptions, all while ensuring continuous maintenance for new instances, turning observability into an unwelcome side quest.
|
By Ankit Anand
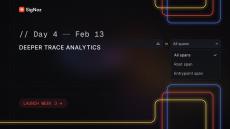
Debugging distributed systems can often feel like searching for a needle in a haystack. When issues arise, engineers need faster ways to pinpoint critical spans within their traces. With our latest Deeper Trace Analytics update, SigNoz now enables powerful filtering for root and entry spans—making it significantly easier to analyze and debug distributed traces.
|
By Ankit Anand
Messaging queues power modern distributed systems, handling background tasks, event-driven architectures, and real-time data streaming. However, debugging issues in Kafka and Celery queues has traditionally been a black box, with limited correlation between message producers, consumers, and broker metrics. With OpenTelemetry-powered Kafka & Celery monitoring, SigNoz introduces the industry's first fully integrated observability solution for messaging queues powered by OpenTelemetry.
|
By Ankit Anand
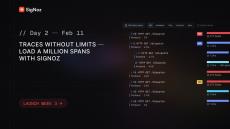
Observability at scale is challenging—especially when dealing with high-volume distributed traces. Traditional tracing tools struggle with large traces containing thousands of spans, often leading to sluggish UIs and an unmanageable debugging experience. Most tracing tools we checked have a limit on the maximum spans they can load for a single trace. But with SigNoz, we’ve redefined what’s possible.
|
By Ankit Anand
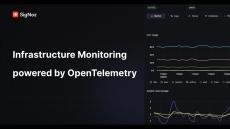
Today, we’re excited to announce a much-awaited feature in SigNoz: Infrastructure Monitoring, built natively on OpenTelemetry. Infrastructure monitoring is a critical aspect of modern observability. Without proper visibility into your infrastructure resources, troubleshooting issues, optimizing costs, and maintaining performance become challenging.
|
By Ankit Anand
Answer a few questions to get personalized recommendations in 30 seconds Start Now The rising costs and complexities of monitoring cloud infrastructure are pushing many organizations to explore alternatives to Datadog. With monthly bills sometimes reaching thousands of dollars and feature sets that can be overwhelming, teams are looking for practical, cost-effective solutions that better fit their needs.
|
By Ankit Anand
Both DataDog and Prometheus are application monitoring tools aimed to improve application performance. While Datadog is a cloud-based SaaS solution, meaning there's no need to install or maintain any infrastructure, Prometheus is an open-source tool that requires manual download and installation on your infrastructure. Let us compare DataDog and Prometheus to see which tool suits The biggest difference between Datadog and Prometheus is that while Prometheus is open-source, Datadog is proprietary.
|
By Favour Daniel
Both Kibana and Grafana are data visualization tools providing users capabilities to explore, analyze and visualize data with dashboards. The difference between Kibana and Grafana lies in their genesis. Kibana was built on top of the Elasticsearch stack, famous for log analysis and management. In comparison, Grafana was created mainly for metrics monitoring supporting visualization for time-series databases.
|
By Ankit Anand
ELK is the acronym Elasticsearch, Logstash, and Kibana, and combined together, it is one of the most popular log analytics tools. Elastic changed the license of Elasticsearch and Kibana from the fully open Apache 2 license to a proprietary dual license. The ELK stack is also hard to manage at scale. In this article, we will discuss 14 ELK alternatives that you can consider using.
|
By Favour Daniel
Are you looking for Grafana alternatives? Then you have come to the right place. Grafana started as a data visualization tool. It slowly evolved into a tool that can take data from multiple data sources for visualization. For observability, Grafana offers the LGTM stack (Loki for logs, Grafana for visualization, Tempo for traces, and Mimir for metrics). You need to configure and maintain multiple configurations for a full-stack observability setup.
|
By SigNoz
Native AWS Integrations with AutoDiscovery Demo.
|
By SigNoz
SigNoz is now the only open-source distributed tracing tool capable of loading a million spans seamlessly. With our latest improvements, users can navigate, analyze, and debug even the largest traces effortlessly.
|
By SigNoz
Debugging distributed systems can often feel like searching for a needle in a haystack. When issues arise, devs need faster ways to pinpoint critical spans within their traces. With our latest Deeper Trace Analytics update, we now enable powerful filtering for root and entry spans — making it significantly easier to analyze and debug distributed traces.
|
By SigNoz
Today, we’re excited to announce a much-awaited feature in SigNoz: Infrastructure Monitoring. With our latest OpenTelemetry-powered Infra Monitoring, we bring you a native OpenTelemetry experience that seamlessly integrates infrastructure metrics with application performance data.
|
By SigNoz
Today, we are excited to announce OpenTelemetry-powered messaging queue monitoring in SigNoz. Debugging issues in Kafka and Celery queues has traditionally been a black box, with limited correlation between message producers, consumers, and broker metrics. With our messaging queue monitoring, teams can correlate Kafka broker metrics with OpenTelemetry spans, enabling deep insights into consumer lag, throughput, drop rates, and performance bottlenecks.
|
By SigNoz
Out-of-box OpenTelemetry-powered Kafka & Celery monitoring.
|
By SigNoz
OpenTelemetry Powered Infrastructure Monitoring Demo.
|
By SigNoz
Infrastructure monitoring module based on OpenTelemetry This is our first release with infra monitoring module and we have added support for: In roadmap If you need any clarification or find something missing, feel free to raise a GitHub issue with the label documentation or reach out to us at the community slack channel.
- February 2025 (13)
- January 2025 (7)
- December 2024 (5)
- November 2024 (6)
- October 2024 (2)
- September 2024 (34)
- August 2024 (13)
- July 2024 (2)
- June 2024 (6)
- May 2024 (19)
- April 2024 (2)
- March 2024 (4)
- February 2024 (15)
- January 2024 (20)
- December 2023 (12)
- November 2023 (15)
- October 2023 (19)
- September 2023 (11)
- August 2023 (21)
- July 2023 (7)
- June 2023 (12)
- May 2023 (4)
- April 2023 (5)
- March 2023 (5)
- February 2023 (10)
- January 2023 (4)
- December 2022 (13)
- November 2022 (2)
- October 2022 (1)
- September 2022 (8)
- August 2022 (7)
- July 2022 (12)
- June 2022 (19)
- May 2022 (7)
- April 2022 (3)
- March 2022 (6)
- February 2022 (3)
- January 2022 (1)
- December 2021 (1)
- November 2021 (3)
- October 2021 (3)
- September 2021 (9)
- August 2021 (6)
- July 2021 (4)
- June 2021 (2)
- May 2021 (2)
- April 2021 (2)
- February 2021 (2)
- November 2020 (1)
- July 2020 (1)
- May 2020 (1)
- January 2020 (1)
- November 2019 (4)
- September 2019 (1)
- August 2019 (2)
Open-source Observability platform. Understand issues in your deployed applications & solve them quickly.
Why SigNoz?
- Your data in your boundary: No need to worry about GDPR and other data protection laws. All your tracing and monitoring data is now in YOUR infra.
- Forget HUGE SaaS bills: No abrupt pricing changes. No unexpected month-end bills. Get transparent usage data.
- Take Control: No abrupt pricing changes. No need to spend weeks in vendor slack for that one small feature. Extend SigNoz to suit your needs.
Single pane for complete metrics and traces, no need to shift to different systems.


