Operations | Monitoring | ITSM | DevOps | Cloud

August 2024

Elasticsearch vs MongoDB - Battle of Search and Store

Elasticsearch is primarily a search engine optimized for fast, complex search queries, especially text searches, and is often used for log and event data analysis. MongoDB, on the other hand, is a general-purpose, document-oriented database that excels in storing and retrieving structured and semi-structured data. It is commonly used for mobile, social, and IoT applications. While Elasticsearch provides superior search capabilities, MongoDB offers more robust data processing and storage features.

Jaeger vs Zipkin - Choosing the Right Tracing Tool

Distributed tracing is becoming a critical component of any application's performance monitoring stack. However, setting it up in-house is an arduous task, and that's why many companies prefer outside tools. Jaeger and Zipkin are two popular open-source projects used for end-to-end distributed tracing. Let us explore their key differences in this article.

Mastering Microservices Logging - Best Practices Guide

Microservices architectures have revolutionized software development, enabling scalability and flexibility. However, they also introduce complexities in system monitoring and troubleshooting. Effective logging is crucial for maintaining visibility and diagnosing issues in these distributed environments. This comprehensive guide explores best practices for microservices logging, helping you navigate the challenges and implement robust logging strategies.

Cloud Infrastructure Explained - Components and Benefits

Cloud infrastructure provides the hardware and software components that power cloud computing. It allows you to focus on your business logic instead of managing physical resources. In this article, you'll learn about cloud infrastructure, its benefits, and core components. You'll also explore delivery and deployment models that cater to different business needs, and discover how SigNoz can help you monitor and optimize your cloud infrastructure.

Understanding Alert Fatigue - Causes and Prevention Strategies

Alert fatigue plagues cybersecurity and IT professionals, compromising their ability to respond effectively to genuine threats. This phenomenon occurs when an overwhelming volume of alerts desensitizes responders, leading to missed critical notifications and increased security risks. Understanding alert fatigue is crucial for organizations aiming to maintain robust security postures and operational efficiency.

Implementing OpenTelemetry in Spring Boot - A Practical Guide

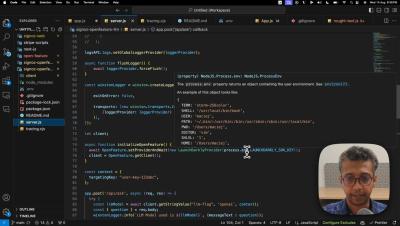
OpenTelemetry can auto-instrument your Java Spring Boot application to capture telemetry data from a number of popular libraries and frameworks that your application might be using. It can be used to collect logs, metrics, and traces from your Spring Boot application. In this tutorial, we will integrate OpenTelemetry with a Spring Boot application for traces and logs. Before the demo begins, let's have a brief overview of OpenTelemetry.

Why is observability important for TableFlow, and how does SigNoz help?

Monitor your applications and troubleshoot problems in your deployed applications, an open-source alternative to DataDog, New Relic, etc. Backed by Y Combinator. SigNoz helps developers monitor applications and troubleshoot problems in their deployed applications. SigNoz uses distributed tracing to gain visibility into your software stack.

Platform Engineering - Empowering Developers with Self-Service Tools

In the world of DevOps and cloud engineering, a new buzzword has emerged: Platform Engineering. This concept has sparked discussions across the industry, with professionals debating whether it replaces traditional DevOps or adds value to it. In reality, Platform engineering transforms how software teams work. It builds on DevOps principles to create self-service tools that boost developer productivity. This approach streamlines workflows, enhances security, and cuts operational costs.

OpenTelemetry vs. OpenTracing - Decoding the Future of Telemetry Data

OpenTelemetry and OpenTracing are open-source projects used to instrument application code for generating telemetry data. While OpenTelemetry can help you generate logs, metrics, and traces, OpenTracing focuses on generating traces for distributed applications. If you’re thinking of choosing between OpenTelemetry and OpenTracing, go for OpenTelemetry. OpenTracing is now deprecated, and users of OpenTracing are advised to migrate to OpenTelemetry.

Kibana vs. Grafana - A Scenario-Based Decision Guide [2024]

Both Kibana and Grafana are data visualization tools providing users capabilities to explore, analyze and visualize data with dashboards. The difference between Kibana and Grafana lies in their genesis. Kibana was built on top of the Elasticsearch stack, famous for log analysis and management. In comparison, Grafana was created mainly for metrics monitoring supporting visualization for time-series databases.

OpenTelemetry vs Datadog - Choosing the Right Monitoring Tool

OpenTelemetry and DataDog are both used for monitoring applications. While OpenTelemetry is an open source observability framework, DataDog is a cloud-monitoring SaaS service. OpenTelemetry is a collection of tools, APIs, and SDKs that help generate and collect telemetry data (logs, metrics, and traces). OpenTelemetry does not provide a storage and visualization layer, while DataDog does.

Prometheus vs InfluxDB - Key Differences, concepts, and similarities

Prometheus and InfluxDB are open-source projects created to make application performance monitoring a breeze. That is, of course, if you choose the option that covers your entire observability scope. This article compares and contrasts the extent to which Prometheus and InfluxDB remedy the need for real-time insights into your applications’ operations. We’ll highlight similarities and overlaps in both usability and practicality.