Operations | Monitoring | ITSM | DevOps | Cloud

The latest News and Information on DevOps, CI/CD, Automation and related technologies.

Top Cloud Deployment Tools And How To Choose The Right One

For DevOps teams, ideal cloud deployment tools mean automation, consistency, and operational reliability. For CTOs, they ensure faster time to market, scalability, and efficiency. And for CFOs, cost-effectiveness and healthy margins are the name of the game. This is our hand-picked list to help you choose the right cloud deployment tools for your organization’s specific needs.


Understanding Syslog Formats: A Quick and Easy Guide

Syslog is the backbone of logging in many Linux and Unix-based systems, playing a crucial role in monitoring, debugging, and auditing. But not all syslog messages are created equal. Depending on your system, software, and logging configuration, syslog messages may follow different formats. This guide walks you through the different syslog formats, why they matter, and how to work with them effectively.

Log Retention: Policies, Best Practices & Tools (With Examples)

Logs are the backbone of debugging, security, compliance, and performance monitoring. But if you don’t manage retention properly, you’ll either drown in unnecessary data or lose critical insights too soon. Log retention is all about striking a balance between keeping what’s necessary and discarding what’s not.

High Cardinality Explained: The Basics Without the Jargon

Cardinality refers to the number of unique values in a dataset column. A column with many distinct values—like a user ID or timestamp—has high cardinality, while a column with limited distinct values—like a boolean flag (true/false) or a category with a few possible options—has low cardinality. For example, consider a database of an e-commerce platform.

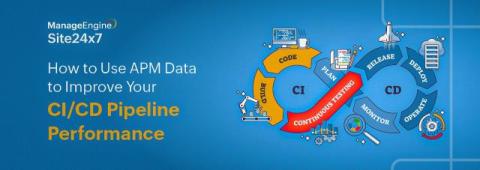
How to use APM data to improve your CI/CD pipeline performance

Agile production has become the norm for software development cycles. The backbone for such a fast-paced landscape is the continuous integration and continuous delivery (CI/CD) pipeline. But merely depending on the CI/CD pipeline isn’t enough, even though the automated workflows give you a competitive edge. The pipeline needs to be optimized to function at its best. This is where monitoring your applications within the pipeline can be a game-changer.

SecureBridge 10.7 Now Available: Stronger Security and Optimized Performance

We are excited to introduce a new version of SecureBridge 10.7 – a suite of client and server components for SSH, SFTP, FTPS, HTTP/HTTPS, SSL, WebSocket, and SignalR protocols – packed with enhanced security, optimized performance, and extended functionality for secure data transmission.

Scraping NGINX Metrics with OpenTelemetry & Exporting to Carbon

Looking for a straightforward way to collect NGINX metrics with OpenTelemetry and send them to your Graphite-based monitoring setup? Unlike Prometheus, which requires configuring scrape jobs and query language nuances, Carbon/Graphite offers a simpler setup with minimal overhead—just send metrics as plain text and query them easily with familiar tools like Grafana. Whether you're setting up dashboards, alerts, or just keeping an eye on traffic, this guide will get you actionable insights in no time!

How to find and test critical dependencies with Gremlin

Part of the Gremlin Office Hours series: A monthly deep dive with Gremlin experts. Pop quiz - what are all of the dependencies your services rely on? If you’re like most engineers, you probably struggled to come up with the answer. Modern applications are complex and rely on dozens (if not hundreds) of dependencies. Many teams rely on spreadsheets, but manual processes like these break down over time. What if you had a tool that found and tracked dependencies for you?