|
By Lauren Barnes
When discussing observability, the “big 3” - logs, metrics, and traces, always get mentioned. But for some, more data doesn’t always mean better. Our lead engineer, JJ, had some advice to share about how logs may not be necessary for everyone. Simplifying your observability stack isn’t difficult - you just need to be intentional with implementation. Check out more MetricFire blog posts below, and our hosted Graphite service! Get a free trial and start using MetricFire now!
|
By Benjamin Pitts
If you're looking for a straightforward way to collect NGINX metrics via OpenTelemetry and send them to your Graphite-based monitoring setup, this article is for you! With minimal configuration you’ll be collecting key metrics from your NGINX connections within minutes. In this article, we'll explain how to install the OpenTelemetry Collector, and easily configure it to receive and export NGINX metrics to a Hosted Carbon endpoint.
|
By Benjamin Pitts
Looking for a straightforward way to collect NGINX metrics with OpenTelemetry and send them to your Graphite-based monitoring setup? Unlike Prometheus, which requires configuring scrape jobs and query language nuances, Carbon/Graphite offers a simpler setup with minimal overhead—just send metrics as plain text and query them easily with familiar tools like Grafana. Whether you're setting up dashboards, alerts, or just keeping an eye on traffic, this guide will get you actionable insights in no time!
|
By Elliot Langston
Server monitoring is crucial to learn these days to use your servers efficiently. It helps optimize the performance of a server and diagnose issues productively. One useful tool used these days is Graphite, which helps monitor a server’s performance and provides graphing solutions by gaining valuable insights into your server. You can explore MetricFire’s Hosted Graphite service today by signing up for a free trial or booking a demo session.
|
By Benjamin Pitts
If you're already using OpenTelemetry for tracing and logs, adding otelcol-contrib as an agent for system metrics just makes sense. It keeps everything in the same pipeline, so you’re not juggling multiple monitoring tools or dealing with inconsistent data formats. Plus, with built-in support for host metrics, custom processing, and direct exports to Graphite, it’s a solid way to ship performance data without extra overhead.
|
By Charlie von Metzradt
We’ve supported syncing your metrics from Kinesis Streams, Amazon’s streaming data platform, for several years. Kinesis Streams helps you gather and process streaming data which can then be monitored in your Hosted Graphite account. Recently, we’ve added support for Firehose, a fully managed and scalable service that allows users to stream data to destinations like Amazon Simple Storage Service (Amazon S3), Amazon Redshift, or Amazon Elasticsearch Service (Amazon ES).
|
By MetricFire Blogger
It has been said that software engineers are organisms that convert caffeine into code. Not all software engineers need coffee to get by, but it's popular enough that it'd be silly for us not to have an office coffee machine... …it'd also be sort of silly for a monitoring company not to monitor that coffee machine, which is so crucial that we could make a reasonable argument for it being part of the production infrastructure.
|
By Benjamin Pitts
PostgreSQL is a beast when it comes to handling data, but if you're running an instance that needs to be accessed remotely, securing it with SSL is non-negotiable. Without SSL, your database connection is essentially an open book for anyone snooping on the network. Let’s lock it down with properly signed certificates!
|
By Benjamin Pitts
So, you’ve got a PostgreSQL database packed with juicy data, and you want to turn those raw numbers into slick, interactive Grafana dashboards? Good call! Grafana’s PostgreSQL datasource is like the secret handshake that lets you visualize your data in style—no extra ETL magic required. In this guide, we’ll walk through getting PostgreSQL and Grafana to play nice, covering everything from connection settings to query tuning.
|
By Lauren Barnes
Today, server uptime is crucial for maintaining business operations and user satisfaction. Monitoring your servers enable you to proactively solve problems rather than fight fires as they come up. This article will show you how you can monitor your servers manually and automatically using MetricFire.
|
By MetricFire
This tutorial will show you the steps to successfully send your metrics using our HostedGraphite. We talk about all types of protocols supported, manipulating the metrics sent in graphs, types of metrics, and much more.
|
By MetricFire
Learn how to install and use MetricFire Telegraf in this tutorial. Telegraf is a collector agent for metrics and events from systems. Telegraf allows you to collect metrics from multiple systems and visualize the data in various ways. This Telegraf tutorial will walk you through the installation process and show you how to use the tool to collect metrics and events from systems. This is a great way to monitor your systems and track the performance of your applications in real time.
|
By MetricFire
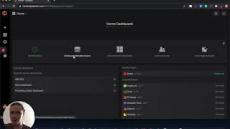
In this video, we explore MetricFire’s powerful dashboarding platform. Discover how to customize your dashboard to view the metrics that matter most to your business. With a variety of visualization options and an intuitive interface, creating and editing charts, tables, and graphs has never been easier. Share your dashboard with your team and keep everyone on the same page. Join MetricFire and start tracking your business metrics today.
|
By MetricFire
Learn more about the functionalities of MetricFire's Hosted Graphite service. Including dashboards, alerting, add-ons, team features and more. MetricFire has everything you could need for a complete monitoring solution.
|
By MetricFire
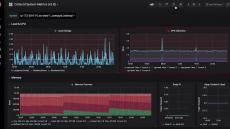
MetricFire provides powerful monitoring at any scale. Measure, analyze and visualize large amounts of data about your applications and back-end systems without any of the hassles of setting up your own server, or worrying about scaling, backups or maintenance.
|
By MetricFire
Know how your app supports your business.
|
By MetricFire
Monitoring with Prometheus Understanding and Using Prometheus (With real examples)
- February 2025 (9)
- January 2025 (6)
- December 2024 (6)
- November 2024 (13)
- October 2024 (4)
- September 2024 (5)
- August 2024 (14)
- July 2024 (8)
- June 2024 (2)
- May 2024 (7)
- April 2024 (1)
- March 2024 (8)
- February 2024 (3)
- January 2024 (6)
- December 2023 (9)
- November 2023 (9)
- October 2023 (17)
- September 2023 (28)
- August 2023 (22)
- July 2023 (27)
- June 2023 (21)
- May 2023 (11)
- April 2023 (11)
- March 2023 (3)
- February 2023 (3)
- January 2023 (3)
- December 2022 (3)
- November 2022 (27)
- October 2022 (5)
- September 2022 (2)
- July 2022 (4)
- June 2022 (2)
- May 2022 (2)
- April 2022 (1)
- March 2022 (3)
- February 2022 (2)
- December 2021 (2)
- November 2021 (1)
- October 2021 (1)
- September 2021 (5)
- June 2021 (2)
- May 2021 (4)
- April 2021 (2)
- March 2021 (14)
- February 2021 (5)
- January 2021 (5)
- December 2020 (2)
- November 2020 (6)
- October 2020 (18)
- September 2020 (3)
- August 2020 (5)
- June 2020 (2)
- April 2020 (3)
- March 2020 (2)
- June 2019 (1)
MetricFire provides a complete infrastructure and application monitoring platform from a suite of open source monitoring tools. Depending on your setup, choose Hosted Prometheus or Graphite and view your metrics on beautiful Grafana dashboards in real-time.
Understand your data at a glance with our simple, flexible, and affordable monitoring platform:
- Graphite. Supercharged. We took the good parts of open-source Graphite and added everything it's missing: a built in agent, team accounts, granular dashboard permissions, and integrations to other technologies and services like AWS, Heroku, logging tools and more.
- Powerful, scalable, Prometheus monitoring. We offer Prometheus as-a-service, with all the capabilities missing from vanilla Prometheus – Grafana dashboards, long-term storage, and deeply technical support when you need it.
- View your monitoring data on beautiful Grafana dashboards – in real time. Get a deeper understanding of your data on a slick, feature-rich graph and dashboard editor.
Hosted Graphite and Prometheus with Grafana Dashboards.


