Operations | Monitoring | ITSM | DevOps | Cloud

December 2024

MetricFire add-on: Show Sentry Errors in Annotations

‍ The solution: We can use Sentry to track specific errors that occur on production and Hosted Graphite's Sentry webhook add-on to add annotations to our system performance graphs. This way, we can correlate when a specific error occurs with our system usage spikes. ‍ Sentry is an application that alerts you when an app gets an error. It can also alert you to specific mistakes so you can see when and where something broke.

Understanding Docker Networking

This series will guide you through the most crucial container networking concepts. You don't need to be a Docker expert to comprehend the ideas introduced here, though a basic understanding of networking, Docker, and Kubernetes is required. Docker is a tool designed to create, build, and run isolated environments inside containers. It's widely used to containerize applications to run inside lightweight containers.

AWS EKS: Architecture and Monitoring

AWS Elastic Container Service for Kubernetes (EKS) is a managed service ideal for large clusters of nodes running heavy and variable workloads. Because of how account permissions work in AWS, EKS's architecture is unusual and creates slight differences in your monitoring strategy. Overall, it's still the same Kubernetes you know and love.

AWS microservices overview

With the nearly unmatched reliability and scalability offered by the 12-factor application design pattern, microservice-based designs have become a fundamental architectural pattern for modern applications. A whole industry of cloud providers has sprung up to offer management of the sophisticated middleware and infrastructure services that make this possible. Amazon Web Services (AWS) is among the largest of them.

Step by Step Guide to Monitoring Apache Spark with MetricFire

Apache Spark is a powerful tool for processing and analyzing large datasets quickly, whether you're cleaning data for a report, running machine learning models, or analyzing real-time data streams. It's widely used for everything from building big data pipelines to crunching numbers for advanced analytics, thanks to its speed and ability to scale across clusters.

Easiest Way to Monitor Your API Endpoints Using Telegraf

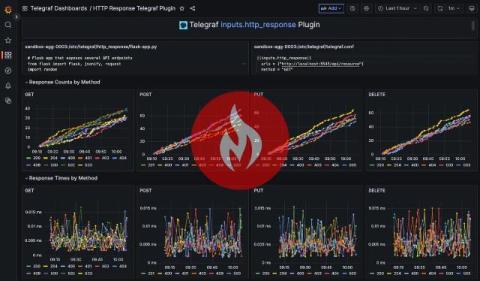
Monitoring the health of your API endpoints is crucial to keeping your applications running smoothly and ensuring users have a reliable experience. Keeping an eye on 4XX and 5XX status codes can help you spot issues like client errors, misconfigurations, or server problems before they get out of hand. Plus, setting up alerts for when these errors spike allows you to react quickly, fix problems, and maintain a high-quality service that your users can count on.