The world of software is growing more complex, and simultaneously changing faster than ever before. The simple monolithic applications of recent memory are being replaced by horizontal cloud-native applications. It is no surprise that such applications are more complex and can break into infinitely more ways (and ever new ways). They also generate a lot more data to keep track of. The pressure to move fast means software release cycles have shrunk drastically from months to hours, with constant change being the new normal.
Here's a scenario. All your enterprise apps are running fine, as you expected. Maybe your team wasn't impacted by the Microsoft 365 outage a couple of weeks ago. Good for you! But don't let past application performance predict current performance. Instead, choose real-time monitoring to efficiently manage your network and proactively resolve app health issues at any time. That way, the IT operations (ITOps) team has visibility into your entire digital estate and pinpoint services unavailable to end-users.
Native app development is the creation of software programs that run on specific devices and platforms. You can build native apps for desktops, smart TVs, and so on - but since the most popular target devices are smartphones, native app development is frequently used to mean mobile app development. According to Statista's latest data, Google's Android and Apple's iOS operating systems have squeezed every other mobile OS out of the market over the years, and in the fourth quarter of 2022, they made up 99.4 percent of the total mobile market.
Apache Kafka has come a long way since its initial development at LinkedIn in 2010 and its release as an open-source project the following year. Over the past decade, it has grown from a humble messaging bus used to power internal applications into the world's most popular streaming data platform. Its evolution is remarkable, and it has taken the industry by storm, quickly becoming a go-to solution for data streaming and processing.
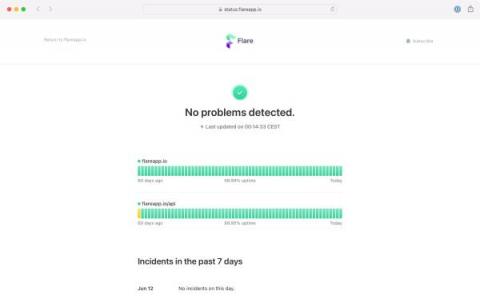
Late last year we announced improvements to our public dashboards that included a revamped dashboard design that allowed users to see monitoring data in a more easily-digestible way, on any device. We improved performance across the board, and also introduced new incident management functionality—available for paid plans only—that allows users to more easily communicate scheduled maintenance notices and alert developers to minor and major incidents.
We have recently extended the native machine learning (ML) based anomaly detection capabilities of Netdata to support all metrics, regardless on their collection frequency (update every). Previously only metrics collected every second were supported, but now Netdata can run anomaly detection out of the box with zero config on metrics with any collection frequency.