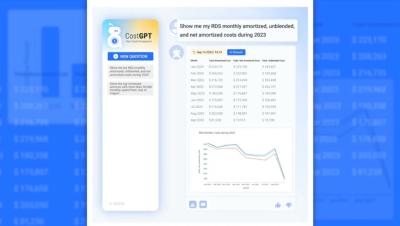
Introducing CostGPT
Introducing CostGPT: Anodot’s New AI Tool gives instant insights into cloud cost structure. Get actionable cloud cost insights by simply asking a question!


Graphite and Prometheus are both great tools for monitoring networks, servers, other infrastructure, and applications. Both Graphite and Prometheus are what we call time-series monitoring systems, meaning they both focus on monitoring metrics that record data points over time. At MetricFire we offer a hosted version of Graphite, so our users can try it out on our free trial and see which works better in their case.
Behind the trends of cloud-native architectures and microservices lies a technical complexity, a paradigm shift, and a rugged learning curve. This complexity manifests itself in the design, deployment, and security, as well as everything that concerns the monitoring and observability of applications running in distributed systems like Kubernetes. Fortunately, there are tools to help developers overcome these obstacles.
Sometimes innovation requires ideas unconstrained by traditional structures and removed from day-to-day responsibilities. It was in this spirit that PagerDuty’s People HackWeek–a friendly competition to explore how generative AI might impact the future of HR–was born.
The report is so absurd and naive that it makes no sense to critique it in detail. - Kent Beck responding to the McKinsey Report. Luckily this was a hollow threat, because a few days later he and fellow blogger Gergely Orosz released a two part blog series critiquing not exactly Mckinsey's report but... any report that tried to put “effort based” metrics at the top of the list for things to track.
We are delighted to announce the release of a new version of Rancher Desktop. This release includes significant enhancements to features such as Deployment Profiles, mount types support, networking proxy configuration, and other important bug fixes.
The C printf function is a staple of embedded development. It’s a simple way to get logs or debug statements off the system and into a terminal on the host. This article explores the various ways to get printf on Cortex-M microcontrollers.