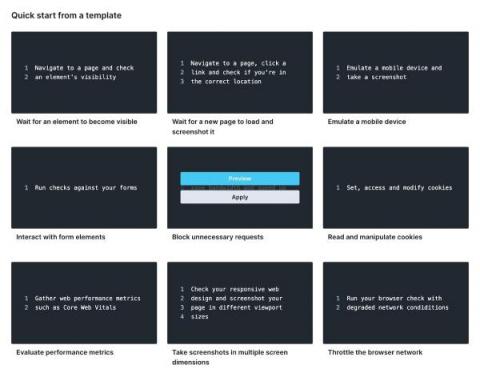
The monitoring and testing of public applications and APIs is challenging by itself. What should you test? How often should you run your tests? And who should be alerted? A scalable monitoring setup includes many hidden details, but technically it’s straightforward. Call public APIs and see if they do what they’re supposed to.
Today, we are excited to announce that the MySQL integration has received an important update, which includes a new pre-built MySQL logs dashboard and the Grafana Agent configuration to view and collect MySQL server logs. The integration is already available in Grafana Cloud, our platform that brings together all your metrics, logs, and traces with Grafana for full-stack observability.
It feels a bit surreal stepping into the Regional Vice President of Sales position here at BigPanda just a few months after the company achieved Unicorn status. In more than 15 years of managing enterprise software sales, this is the first time I knew I was going to play a critical role in facilitating a company’s ascension to the top of their sector. Even in college, I knew this is what I wanted.
If you are new to Docker, you may find it challenging to understand all the terms. It can seem like everyone has a different idea of what Docker terms mean, and sometimes, terms get used interchangeably. For instance, you — like others who are learning about Docker — may wonder how a Docker image differs from a Docker container. Their contrasts are subtle but significant.
We’re thrilled to announce that Ivanti Neurons is the recipient of the “Top 50 IT Management Products for 2022” award by G2 users. The annual Best Software awards list is curated to rank the most renowned software companies and products globally to help aid users in their buying decisions. We are truly honored to receive this award from G2.