

Ahmedabad, India
2010
  |  By Poonam Lalani
When someone leaves your organization, how sure are you that every account they could reach was closed? Most IT offboarding starts by disabling the employee's main login account, and that step usually works. The risk comes from the other accounts, tools and devices the person used that the main account does not control. These include personal API tokens, shared vendor portal logins, laptops still with a courier and SaaS tools bought on a department card.
  |  By Poonam Lalani
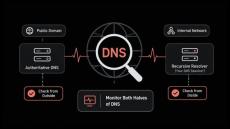
Why does every page, login and business application hesitate before anything loads, even when bandwidth graphs look healthy? That pause usually comes from name resolution: no connection starts until its hostname has been translated into an IP address, and whatever time that translation takes is added to the request. Slow DNS seldom shows up as a clear error.
  |  By Ramya Shah
Most bandwidth problems get investigated after the complaints arrive, and by then the traffic that caused them has moved on. The numbers you need sit in several places at once. A laptop knows its own traffic. The router knows what leaves for the internet, and only the switches see how much network bandwidth moves inside the building. Checking bandwidth usage at the right layer saves hours of guessing. Most of the methods ship with hardware you already own.
  |  By Poonam Lalani
Why does a switch port look healthy on every dashboard while people on that floor keep reporting dropped calls and slow file transfers? Often the cause is CRC errors, a port counter that most dashboards do not show by default. Each CRC error means a unit of data arrived damaged and the switch discarded it. Put simply, a CRC error tells you the receiving device noticed the data changed somewhere in transit.
  |  By Ramya Shah
Most shadow IT starts with a marketing team that needed a file-sharing tool on Tuesday. The next procurement cycle was six weeks away. That gap keeps widening. According to Gartner, 75 percent of employees will acquire, modify or create technology outside IT's visibility by 2027, up from 41 percent in 2022. Shadow IT is the name for that tech. IT asset discovery is where it first shows up. In this blog, you will: By the end, you can turn shadow IT into a weekly review queue.
  |  By Ramya Shah
Most network diagrams are accurate exactly once: the day they are finished. The network keeps changing, the drawing does not, and the gap shows up during the next outage. According to the Uptime Institute Annual Outage Analysis 2026, failure to follow established procedures remains the leading driver of human-error outages. A wrong diagram is how a right procedure hits the wrong port. The fix is a network topology diagram that matches the live network topology.
  |  By Ramya Shah
Most networks were never designed. They were extended, one switch and one VLAN at a time, until a single core failure took the site down and nobody could find the diagram. According to the Uptime Institute Annual Outage Analysis 2026, 57 percent of organizations said their most recent major outage cost more than $100,000. Network design is how you stop paying that bill. You decide the network topology, the addressing and the hardware on purpose, before the cabling goes in.
  |  By Poonam Lalani
Why do the same complaints about call quality and slow file transfers keep coming back after the network has been checked and declared healthy? Packet loss is usually the answer, and it survives investigation because it degrades the services people use without taking anything offline. That combination makes it expensive. Equipment gets rebooted, cables get replaced, and tickets go to the internet service provider, often with nobody knowing which segment of the path is discarding traffic.
  |  By Ramya Shah
An IT incident costs the most in the minutes between the first alert and the first owner. Incident management tools exist to shrink that window. However, choosing the best incident management tools is not as straightforward as we’d like it to be. The 2026 market has its own complications, Opsgenie is going away on April 5, 2027, and Squadcast has been folded into SolarWinds.
  |  By Poonam Lalani
Why does the VPN work for most of the company while one branch office, or a handful of remote staff, reports that it won't connect or crawls the moment they sign in? The difficulty with VPN troubleshooting is that the tunnel relies on every layer below it. If the laptop, home Wi-Fi, internet route, gateway, or security policy on either end misbehaves, the connection suffers. One complaint about a slow file share could originate at any of those points.
  |  By Motadata
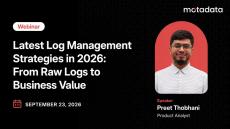
Discover the latest log management strategies for 2026 and learn how AI and automation turn raw logs into actionable insights. See how modern log management can reduce investigation time, improve incident response, control costs, and strengthen visibility across hybrid and multi-cloud environments.
  |  By Motadata
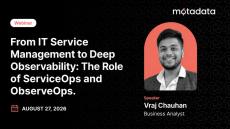
In this webinar recording, discover how ServiceOps and ObserveOps connect IT service management with deep observability. Learn how IT teams can identify root causes faster with unified visibility across incidents, metrics, logs, traces, applications, and infrastructure. Don't forget to like, share, and subscribe for more insights on ITSM, observability, AIOps, and IT operations.
  |  By Motadata
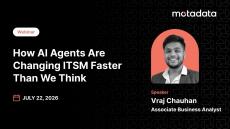
AI is transforming ITSM beyond co-pilots with autonomous AI agents that can understand, decide, and act. In this webinar, discover how AI agents are reducing manual workloads, accelerating incident resolution, improving service quality, and enabling intelligent service operations. Learn real-world use cases, key implementation strategies, and how organizations can move from reactive support to proactive, AI-driven IT service management. Watch now to explore the future of smarter, faster, and more efficient ITSM.
  |  By Motadata
Quantum computing is reshaping the future of cybersecurity. In this video, learn what a Cryptographic Bill of Materials (CBOM) is, why it matters for post-quantum security, and how it helps organizations identify vulnerable cryptography, prioritize migration, and improve cryptographic visibility. Perfect for security professionals, DevSecOps teams, IT leaders, and compliance teams preparing for the quantum era.
  |  By Motadata
Alert fatigue is one of the biggest reasons critical incidents get missed. In this video, learn what alert fatigue is, why it happens, and how reducing noisy, repetitive notifications helps IT teams respond faster to the alerts that actually matter. Whether you're an IT operations professional, SRE, DevOps engineer, NOC analyst, or IT manager, this video explains alert fatigue in simple terms and shares practical ways to reduce alert noise, prioritize critical issues, and improve incident response.
  |  By Motadata
In this video, you'll learn what a Configuration Item (CI) is, how it forms the foundation of a CMDB, and why connecting CIs helps IT teams understand dependencies, improve visibility, and resolve incidents faster. Discover how CIs transform scattered asset data into a complete, connected view of your IT environment. Whether you're an IT Manager, IT Administrator, Service Desk Analyst, ITSM Professional, Infrastructure Engineer, or IT Operations Leader, this video explains why Configuration Items are essential for effective IT Service Management.
  |  By Motadata
A website can look healthy on your dashboard and still fail when customers try to use it. So how do you catch problems before anyone notices them? In this video, you'll learn what synthetic monitoring is, how it works, and why IT teams use it to detect website and application issues before they impact real users. Discover how automated user journeys help you monitor availability, performance, and critical business transactions 24/7.
  |  By Motadata
A self-service portal is designed to reduce IT support tickets by enabling employees to solve common issues on their own. But if self-service is supposed to improve efficiency, why do so many portals remain unused while help desk queues continue to grow? In this video, you'll learn what a self-service portal is, why many organizations struggle with low adoption, and the three key factors that determine whether your portal actually reduces ticket volume.
  |  By Motadata
In this video, learn what packet loss is, why it happens, and how it silently impacts your network performance even when monitoring dashboards appear healthy. Discover the most common causes of packet loss, how it affects applications like video calls and web services, and why identifying the root cause quickly is critical for maintaining a reliable network.
  |  By Motadata
In this video, learn the difference between SLA, SLO, and SLI and why understanding each one is essential for delivering reliable IT services. Discover how these three service level metrics work together and why tracking the right one helps improve service reliability, customer satisfaction, and operational performance. Whether you're an IT operations professional, SRE, DevOps engineer, or service manager, this video explains SLA, SLO, and SLI in simple terms so you can build measurable goals and realistic service commitments.
  |  By Motadata
Log management can be seen as both challenge and as an opportunity, the key is to derive intelligence out of it.

Motadata is an IT monitoring and management software that derives business insights by real-time processing, correlation and intelligent visualization of IT network and security information data. It can collect data from multiple sources, in any format, and analyze it for insights. It unifies traditionally separate IT monitoring data from network devices, server instances, virtual machines, cloud deployments, applications and web servers of NOC and log analytics from SOC in a single powerful platform.

With the increasing complexity of today’s heterogeneous networks, it has become imperative for organizations to invest in a robust IT Operations platforms that not only Monitors, Tracks, Analyses but also Resolves issues even before they impact the end users. Motadata offers a unified product suite consisting of Network Monitoring, Bandwidth Monitoring, Log Management, Configuration Management, Asset Management, Helpdesk, Servicedesk & more under one single platform.

Unified Product Suite for IT Operations and Big Data Analytics:

  • IT Service Management Platform: The ITIL Compliant ITSM platform organizes information, automates workflow, eliminates manual/back-end complexities and encourages self-service for maximum productivity and superior user experience for servicedesk or helpdesk.
  • Infrastructure Intelligence Platform: Motadata’s Infrastructure Intelligence Platform (IIP) proactively monitors & optimizes all network devices, servers, and applications across IT infrastructure to manage network for fault and performance for maximum uptime with network monitoring.
  • Data Analytics Platform: Analyse your machine data to identify trends and unleash undiscovered insights from the vast untouched machine data with Elastic search precision with our bandwidth monitoring & log management in data analytics platform.

Complete Visibility Across Your Dynamic Infrastructure with Wholesome Network Monitoring.