Operations | Monitoring | ITSM | DevOps | Cloud

What a Patch Management Policy Should Contain to Keep Systems Secure and Audit-Ready

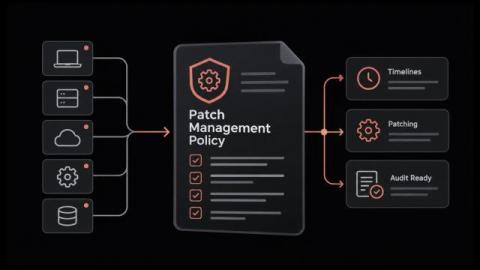
Who decides how fast a critical patch goes out, and who signs off when a production server can't be restarted? For many IT groups, the answer is a mix of one senior admin's judgment, an old ticket and a shared spreadsheet. It holds up fine right until an auditor asks for proof, or that admin leaves. A written policy replaces that guesswork with rules people have agreed to. Owners are named, deadlines are fixed, and there's a plan for the system that can't be patched on time.
Logging as a Service (LaaS): What It Costs and When It Fits

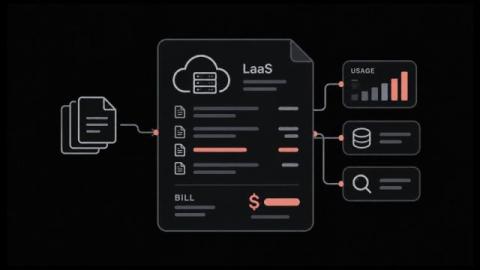
Logging as a Service moves your log management to a provider. They collect, parse, store and search your logs for a monthly fee. The fee is where it goes wrong. Providers meter five different things, and the one written into your contract decides whether ordinary growth doubles your bill. In this blog, you'll see: By the end you'll know which meter your workload lands on. Logging as a Service is a cloud-delivered model for collecting and searching logs.

WAN Link Monitoring for Faster Branch Troubleshooting

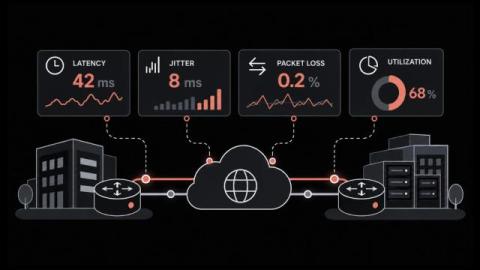
Why do users at a branch complain about choppy calls and stalled apps when every WAN circuit on the dashboard still shows up? A link can be reachable without being healthy. Delay and packet loss can rise for hours on a live circuit, and a simple up-or-down check will report nothing unusual the whole time. WAN link monitoring checks the quality of each site-to-site connection by having routers send their own test packets and time the replies.

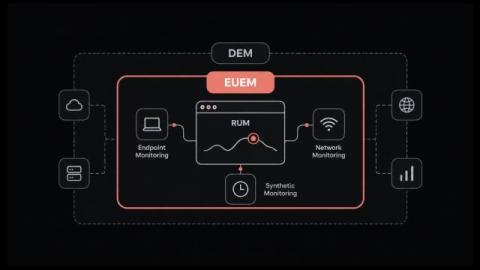
What is End User Experience Monitoring (EUEM)? How It Relates to RUM and DEM

Why do tickets about a slow application keep arriving while every server, link and service check reports normal? That mismatch is the problem end user experience monitoring exists to solve. A healthy server is one thing, but the business notices something else: whether people can finish their work or complete a purchase without delays or errors. Monitoring in most IT operations groups was built to watch the systems from the inside, so it reports CPU load, memory and uptime.

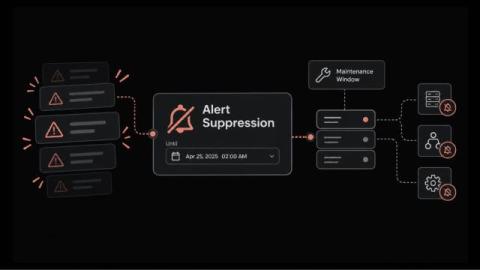
How Alert Suppression Pauses Alerts During Planned Work Without Losing Visibility

How many pages did your on-call engineer get during the last planned firmware upgrade on a core switch? The device stops responding and every dependent check fails. Soon the on-call phone is buzzing with alerts for a change that was approved last week. Alert suppression is a time-limited pause on alerts for a condition you already know about, such as planned work or an issue under investigation. And what is alert suppression from the engineer's side of the console?

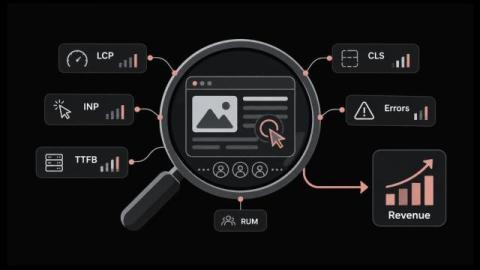
RUM Metrics That Matter for User Experience and Revenue

Why does a page that scores well in testing still draw complaints from customers about slowness? A lab test runs on one fast machine over a stable connection. Customers use older phones, congested mobile networks and browsers loaded with extensions, so their experience can only be measured on their own devices. Real user monitoring captures that experience, and it produces a long list of measurements.

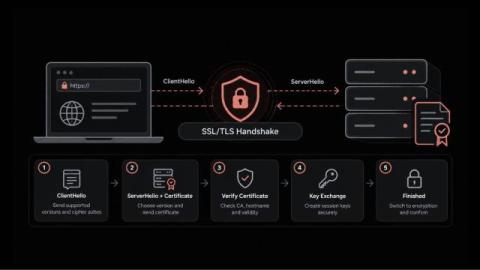
SSL Handshake Guide Covering Each Step and the Fixes That Prevent Outages

Why would a website that passes every uptime check still show customers a security warning? In most cases, the server is running and the network is healthy. The failure happens earlier, during the brief exchange in which the browser and the server agree on how to communicate securely. That moment is the SSL handshake. If it goes wrong, users get an error page while your dashboards stay green. Maybe a certificate expired; maybe a routine change left both sides on different protocol versions.

What Is RMM (Remote Monitoring and Management)?

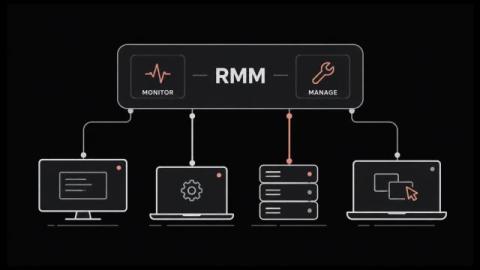
RMM lets one small team look after thousands of machines nobody will ever physically touch. It grew up inside managed service providers. The whole category runs on agent-based monitoring, which means a small program sits on every endpoint and phones home on a schedule. That agent is also why attackers have taken such an interest lately. In this blog, you'll see: By the end you'll know what the category covers and where it stops. RMM stands for remote monitoring and management.

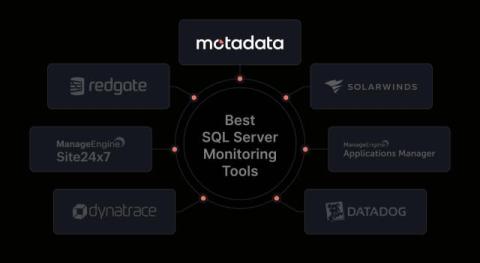
7 Best SQL Server Monitoring Tools for 2026

A slow query can affect an application before the database team knows what is causing it. A blocked session, failed job, or growing database file can create more problems if no one spots it early. That’s where SQL Server monitoring tools come in. They help you track database performance, find slow queries, monitor waits and locks, and see what changed before a problem occurred.

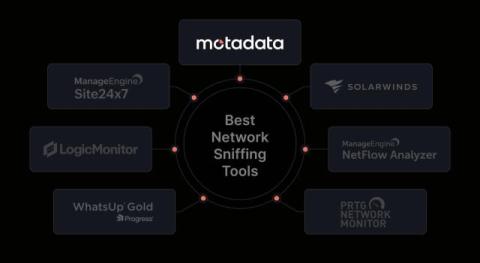
7 Best Network Sniffing Tools for 2026

Ever wondered what is actually using your network when it suddenly slows down? It could be a device sending too much data, a backup running at the wrong time, or an application taking too long to respond. Without visibility into network traffic, finding the real cause can take hours. That’s where network sniffing tools can help. They let you inspect network traffic, capture packets, and see what is happening between devices, servers, and applications.