Operations | Monitoring | ITSM | DevOps | Cloud
Detecting and responding to Cloud Logging events in real-time
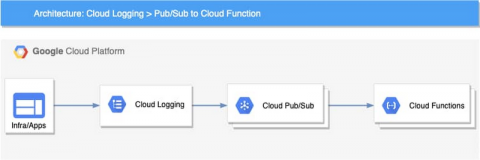
Logging is a critical component of your cloud infrastructure and provides valuable insight into the performance of your systems and applications. On Google Cloud, Cloud Logging is a service that allows you to store, search, monitor, and alert on log data and events from your Google Cloud Platform (GCP) infrastructure services and your applications. You can view and analyze log data in real time via Logs Viewer, command line or Cloud SDK.
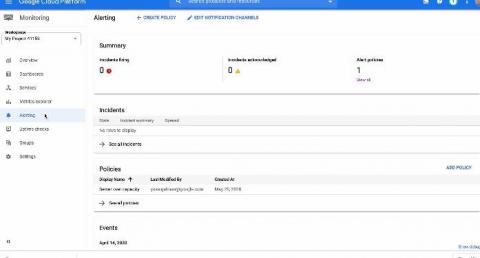
Introducing Pub/Sub as a new notification channel in Cloud Monitoring
Around the world, operations teams are working to automate their monitoring and alerting workflows, looking to reduce the time they spend on rote operational work (what we call “toil”), so they can spend more time on valuable work. For instance, Google’s Site Reliability Engineering organization aims to keep toil below 50% of an SRE’s time, freeing them up to work on more impactful engineering projects.
New ways to manage custom Cloud Monitoring dashboards
Earlier this year, we added a Dashboard API to Cloud Monitoring, allowing you to manage custom dashboards and charts programmatically, in addition to managing them with the Google Cloud Console. Since then, you’ve asked us to provide more sample dashboard templates that target specific Google Cloud services. Many of you have also asked us to provide a Terraform module to help you set up an automated deployment process.
Using Recommenders to keep your cloud running optimally
As a cloud project owner, you want your environment to run smoothly and efficiently. At Google Cloud, one of the ways we help you do that is through a family of tools we call Recommenders, which leverage analytics and machine learning to automatically detect issues and present you with optimizations that you can act on.
How to find-and use-your GKE logs with Cloud Logging
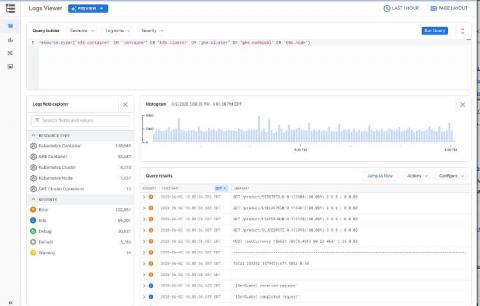
Logs are an important part of troubleshooting and it’s critical to have them when you need them. When it comes to logging, Google Kubernetes Engine (GKE) is integrated with Google Cloud’s Logging service. But perhaps you’ve never investigated your GKE logs, or Cloud Logging? Here’s an overview of how logging works in GKE, and how to configure, find, and interact effectively with the GKE logs stored in Cloud Logging.


