Operations | Monitoring | ITSM | DevOps | Cloud

Change the Cloud Cost Conversation from Spend to Margin

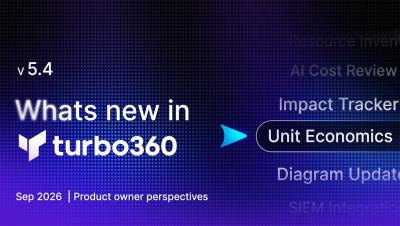
"Our Azure bill went up 20% last month." Without context, finance only sees a rising cost. Unit economics gives them the full picture. Turbo360 lets you overlay business KPIs on your Azure spend. Track units like orders, active users, document views, or monthly recurring revenue alongside cost, and see your cost per unit month over month. Now the conversation becomes: "Orders went up 150% and our cost per order came down." That is a story about efficiency, not overspend.


Auto-Generate Richer Azure Architecture Diagrams

Azure architecture diagrams go out of date fast, and management-plane data alone misses the runtime connections that matter most. In v5.4, diagrams move to their own Diagrams tab in Azure Documenter. Alongside the enhanced network and workload diagrams, there is a new Resource Visualizer diagram. Scope it by subscription and resource group, or write your own custom Azure Resource Graph query to define exactly which resources to include.

How to Do Azure Cost Allocation by Team or Department

Learn how to allocate Azure costs across departments and get a clear view of who is spending what. In this video, we’ll show you practical ways to track and allocate Azure costs by department using Azure cost management practices. You’ll learn how to organize cloud spend, assign costs to teams or business units, improve cost visibility, and make Azure cost discussions easier between finance, engineering, and IT teams.

Unit Economics & AI Cost Review: What's New in Turbo360 v5.4

Move the FinOps conversation from what you spend to the value you get back. Unit Economics puts your own KPIs next to Azure cost so you can talk in margin, not just bill. New holistic trackers prove what your reservations and schedules are really saving, an AI Cost Review agent turns "how are we doing?" into a full analysis in about a minute, and rightsizing now reaches your Log Analytics workspaces.