|
By Nikolay Sivko
We migrated all of our services to Kubernetes about six months ago. At first glance, the task seemed quite simple: deploy a cluster, write application specifications, and that’s it. But, since we’re obsessed with stability, we nevertheless had to learn how k8s works under pressure, so we tested multiple failure scenarios. Most of the questions that arose were network related. One particular point of concern was how Kubernetes Services function.
|
By Pavel Trukhanov
As I wrote in my previous article “USE, RED and real world PgBouncer monitoring” there are some nice commands in PgBouncer’s admin interface that allow to collect stats how things going and spot problems, if you know where to look. This post is about new stats added in these commands in new PgBouncer versions.
|
By Pavel Trukhanov
Brendan Gregg’s USE (Utilization, Saturation, Errors) method for monitoring is quite known. There are even some monitoring dashboard templates shared on the Internet. There’s also Tom Wilkie’s RED (Rate, Errors, Durations) method, which is suggested to be better suited to monitor microservices than USE. We, at okmeter.io, recently updated our PgBouncer monitoring plugin and while doing that we’ve tried to comb everything and we used USE and RED as frameworks to do so.
|
By Pavel Trukhanov
Any changes to a Postgresql database first of all are saved in Write-Ahead log, so they will never get lost. Only after that actual changes are made to the data in memory pages (in so called buffer cache) and these pages are marked dirty — meaning they need to be synced to disk later.
|
By Pavel Trukhanov
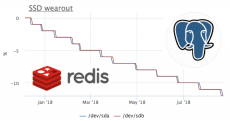
A year ago we’ve added SMART metrics collection to our monitoring agent that collects disk drive attributes on clients servers. So here a couple of interesting cases from the real world.
|
By Pavel Trukhanov
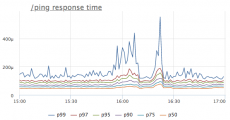
Recently there was a mini-incident in a data center where we host our servers. It did not affect our service after all. And thanks to the right operational metrics, we’ve been able to instantly figure our what’s happening. But then an thought came up to me, how we would’ve been racking our heads trying to understand what’s happening without 2 simple metrics.
|
By Pavel Trukhanov
This is the second part of our two-part article series devoted to Elasticsearch monitoring. The heading of this article refers to Dante Alighieri’s “Inferno”, in which Dante offers a tour through the nine increasingly terrifying levels of hell. Our journey into Elasticsearch monitoring was also filled with hardships, but we have overcome them and found solutions for each case.
|
By Nikolay Sivko
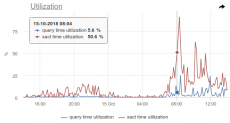
We already wrote about monitoring posgresql queries, at the time we thought that we completely understood how PostgreSQL works with various server resources. Working regularly with the statistics of PostgreSQL queries, we noticed some anomalies and decided to dig a bit deeper for better understanding. Through this process, we found that while the behavior of postreSQL is kind of strange at first glance (or at least very peculiar), the clarity of its source code is quite admirable.
|
By Pavel Trukhanov
We’ve finally made the finishing touches on the elasticsearch monitoring and officially released it. Only after three complete reworks did we manage to achieve really nice results and detect all the issues in any ES cluster setup.
- December 2018 (1)
- October 2018 (1)
- September 2018 (2)
- August 2018 (2)
- March 2018 (2)
- February 2018 (1)
Be ready for any fault in your server infrastructure. Monitoring thousands of server metrics, ready-made for you. So you won’t miss a thing.
Okmeter.io shows you what's going on with your server infrastructure — deep-dive statistics and comprehensible charts provide you with insight about behaviour of server-side processes. Also okmeter.io will alert you on any problems that affect end-users, like slow page loads or server errors. Okmeter.io will help you fix issues faster by showing related odd events and possible problems.
Why okmeter is perfect for you:
- Right metrics out of the box: To know what’s happening, you must collect proper parameters. We collected other people’s experience of how things might go south. And we figured out what metrics to collect to get all the info you need for troubleshooting.
- Auto-detect of common pitfalls: Okmeter has a large knowledge base of typical problems that regularly occur with commonly-used technologies. Okmeter will automatically run 100s of diagnostic checks for each of your servers and subsystems.
- Auto-magical integration: Okmeter will automatically detect every service, process and technology in your cluster and collect all needed metrics. It’ll appear organized in meaningful chart dashboards. All that with no configuration.
- Cluster overview with drill-down: Okmeter metrics engine allows combining 1000s of metrics in one chart to get an overview of your whole cluster. And still you can drill-down to any specific subset you want. That allows you to pinpoint perf issues and root causes easily.
Okmeter auto-magically collects 100s and even 1000s of detailed metrics about every part of your system so you won’t miss a thing.


