Infrastructure monitoring using kube-prometheus operator
Prometheus has emerged as the de-facto open source standard for monitoring Kubernetes implementations. In this tutorial, Kristijan Mitevski shows how infrastructure monitoring can be done using kube-prometheus operator. The blog also covers how the Prometheus Alertmanager cluster can be used to route alerts to Slack using webhooks.
In this tutorial by Squadcast, you will learn how to install and configure infrastructure monitoring for your Kubernetes cluster using the kube-prometheus operator, displaying metrics with Grafana, and configuring alerting with Alertmanager.
Table of contents
- Infrastructure Monitoring
- Prometheus Operator
- Installing the kube-prometheus operator
- Service Interaction
- Adding a custom alerting rule
- Setting up Slack Webhook
- Configuring Alertmanager
- Recap
Infrastructure Monitoring
One of the key principles of running clusters in production is Monitoring.
You must be aware of the resource allocation and limits of each component that is a part of the cluster.
It is of crucial importance to have insight and observability in your cluster be it a Kubernetes one, bare metal, virtual machines, or any other.
A good monitoring solution paired with a set of metrics and alerting will provide a safe environment for your workloads.
It’s safe to say that monitoring a Kubernetes cluster comes in two parts - infrastructure and workload monitoring.
The first part covers the actual infrastructure that supports your workloads. These will be the nodes or instances that host your applications. And by collecting and observing the metrics you will be very well aware of the node's health, usage, and capacity.
The other part that needs to be covered are the workloads and the microservices that you deploy on the cluster.
These can be defined in your applications or in the Kubernetes ecosystem - the pods and containers.
Monitoring just the instances is not enough, since Kubernetes abstracts and adds additional layers for container management, this also needs to be taken into account.
The Pods are entities of their own, each with different resource requirements, limits, and usage.
Prometheus Operator
Before moving on to installing the monitoring stack, let’s have a brief intro on what the Kubernetes Operators and Custom Resources are.
In one of our previous blogs, we explained in detail what and how Kubernetes Operators and Custom Resources are used.
Kubernetes operators take the Kubernetes controller pattern that manages native Kubernetes resources (Pods, Deployments, Namespaces, Secrets, etc) and lets you apply it to your own custom resources.
Custom resources are Kubernetes objects that you define via CRDs (Custom Resource Definitions). Once a CRD is defined, you can create custom resources based on the definition and they are stored by Kubernetes. And you can interact with them through the Kubernetes API or kubectl, just like existing resources.
As you’ve read, both of these resources are extensions to the Kubernetes API and are not available by default like those of Deployment or StatefulSet kinds.
The Prometheus Operator will manage and configure a Prometheus cluster for you. Bear in mind that this contains only the core components.
And instead, in this tutorial, you will deploy the more enhanced - kube-prometheus operator.
The kube-prometheus operator will deploy all the core components plus exporters, extra configurations, dashboards, and everything else required to get your cluster monitoring up to speed.
These configurations can then be easily modified to suit your needs.
You can follow the official link if you wish to compare the differences between the operator deployment options.
Note: Manually deploying the Prometheus stack is still an option. However, you will need to deploy every component separately. This creates operational toil and will require a lot of manual steps until all services are configured and connected properly.
Installing the kube-prometheus operator
Although Kubernetes Operators may sound complex and scary, fear not, their installation is a breeze!
The people contributing to the Prometheus Operator project made its install straightforward.
Just a couple of commands need to be executed and you will have your monitoring set up in the cluster.
Let’s start.
To install the kube-prometheus operator, first clone the repository containing all the necessary files with this command:
Now from inside the kube-prometheus folder, apply the manifests located in the manifests/setup:
What this does is, first it’s creating the monitoring namespace that will contain all deployments for the monitoring stack.
Second, it will create all the necessary RBAC roles, role bindings, and service accounts that are required for the monitoring services to have proper privileges for access and metrics gathering.
And finally, it will create the aforementioned custom resources and custom resource definitions for the Prometheus Operator, and deploy them.
With the previous command you deployed the files for the Operator itself, but not for its services.
Wait a bit until the prometheus-operator pod is up and running.
You can check on it using:
| NAME | READY | STATUS | RESTARTS | AGE |
|---|---|---|---|---|
| prometheus-operator-7775c66ccf-74fn5 | 2/2 | Running | 0 | 58s |
Now you will need to deploy the services next:
Running the above command will deploy:
- Prometheus with High Availability
- Alertmanager with High Availability
- Grafana
- Node exporters
- Blackbox exporter
- Prometheus adapter
- Kube-state-metrics
- And all other supporting services and configurations for the monitoring stack
After a couple of minutes, all the pods should get into a running state. You can verify again using the kubectl get pods command.
You can now port-forward and open the Prometheus, Grafana, and Alertmanager services locally:
Prometheus
Grafana
Alertmanager
It’s best to check and open all of them, just to verify that everything works as expected.
Note: The default user and password for Grafana are admin/admin, after which you will be prompted to create a new password.
If you are greeted by the services user interface, that means the install was successful and you can now explore, and configure the services to fit your needs.
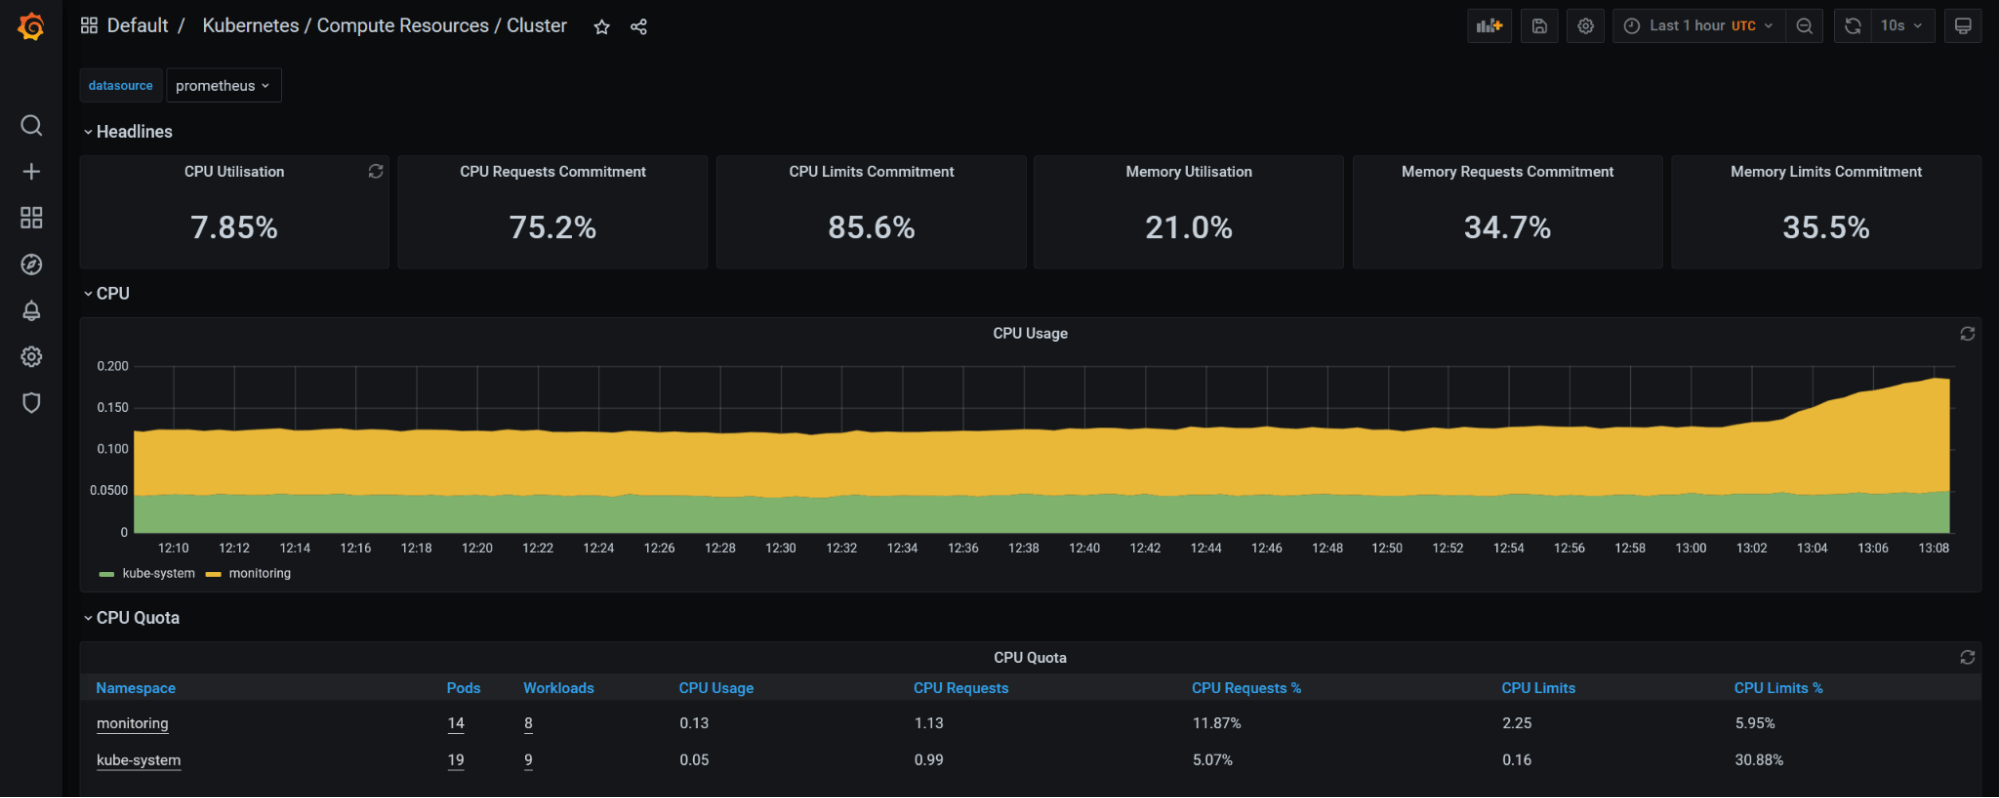
Before moving on, let’s understand how the services are interconnected and what role they serve in the monitoring stack.
Service Interaction
Consider the following diagram:
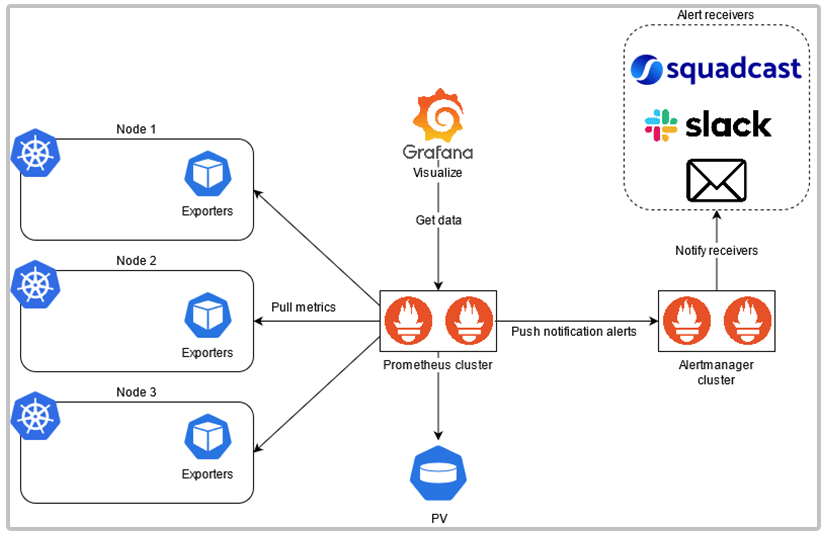
The high-level overview of the stack goes like this:
Prometheus will periodically scrape (or pull) metrics via the configured exporters and metrics servers on the nodes using HTTP.
The exporters don’t send out the data to Prometheus, instead, Prometheus pulls that data from endpoints set by exporters.
The scraped metrics gets time-stamped and stored as time-series data, which get written to a persistent volume for storage, and later for analysis.
A Config Map contains the rules and configurations for Prometheus.
This configuration contains the rules, alerts, scraping jobs, and targets that Prometheus needs to do proper monitoring.
Prometheus uses its own language called PromQL in which alerts can be set, and data queried.
Example of a PromQL query:
To visualize and display the data stored by Prometheus, Grafana comes into the picture.
Grafana connects to Prometheus, sets it as the data source, fetches this data, and displays it through a custom dashboard.
Alertmanager is used to notify us of any alerts. Rules set in Prometheus get evaluated, and once a violation occurs Prometheus pushes this alert notification to Alertmanager.
Once Alertmanager receives this notification, based on its own rules for routing and grouping, it will then send it over to the configured Receivers.
Similar to Prometheus, the Alertmanager rules also get stored separately either in Config Maps or Secrets.
These receivers can be either Squadcast Platform, Slack, Email, or any other configurable incident receiver.
Let’s examine this Prometheus alerting rule:
- name - The name of the rule group; you can have multiple alerts under the same group
- rules - Configured rules under the rule group
- alert - Name of the actual Alert and how it will be displayed once it is firing
- annotations - Under annotations, you can set more details and summaries about the alert firing
- expr - The expression for the alert in PromQL language that gets evaluated
- for - How long will Prometheus wait from first encountering the alert until a notification is sent. If the alert is running for 15minutes or longer, Prometheus will send a notification to Alertmanager
- labels - additional labeling that you can attach to the alert
Using the Go templating language, you can further detail your alert and give a clearer description.
Adding a custom alerting rule
Now that you’ve learned more about how the whole Prometheus setup operates, you can modify its configuration and add your own custom alerting rules.
As explained above, Prometheus gets its configuration data from a Config Map.
If you describe the prometheus-k8s Stateful Set, you will see the prometheus-k8s-rule-files-0 Config Map that contains the config rules.
[other output truncated]
You can now edit the config map and add your custom alert.
Keep in mind that the config map will have a lot of lines!
It’s best to save it and edit it offline:
The configuration inside will be split under separate YAML files. And each file will contain a group of alerts based on common alert targets.
In this case, the example will cover adding an alerting rule under a new group.
But if you like, you can add it under one of the existing alert groups.
Add the following sample alert under the data block:
The alert will fire if our Kubernetes job fails to execute. Which you will test in a moment.
Now comes the tricky part.
Since the owner of the Config Map is the Prometheus Operator, you will need to remove the file ownership data.
Otherwise, any modifications to the Config Map will be reverted back without any changes!
Under the config map metadata field remove anything but the name and namespace, leave those as they are.
[other data truncated]
You can also find the link to the edited config map here.
Finally, replace the existing Config Map with the new one:
configmap/prometheus-k8s-rulefiles-0 replaced
Prometheus will automatically reload the Config Map, and after waiting a bit check on the UI to verify that the alerting rule is created:
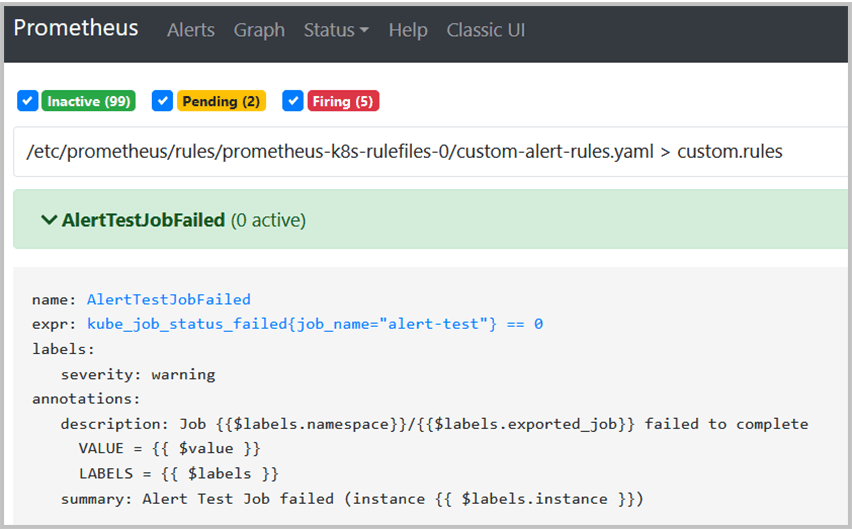
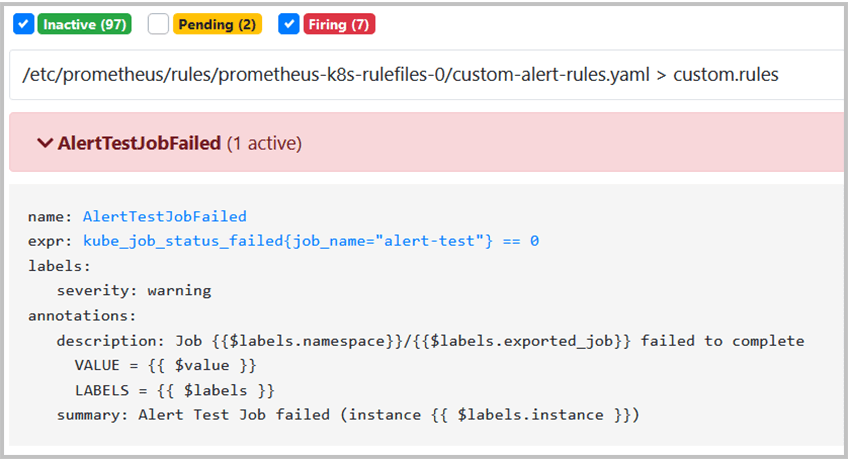
You can now run the test job to check if the alert will fire correctly.
The job will create a pod that will sleep for ten seconds and exit with status 139, thus failing the job and triggering the alert.
Setting up Slack Webhook
Since the monitoring stack is now working, it’s a good idea to configure a receiver and see how alert notifications can be made easier for human view.
Creating a Slack workspace and channel for testing purposes is easy.
If you do not already have a Slack account you can sign up and create one here.
Once logged in, on the left side, in the Channels tab click on the plus sign and create a separate channel for alerts.
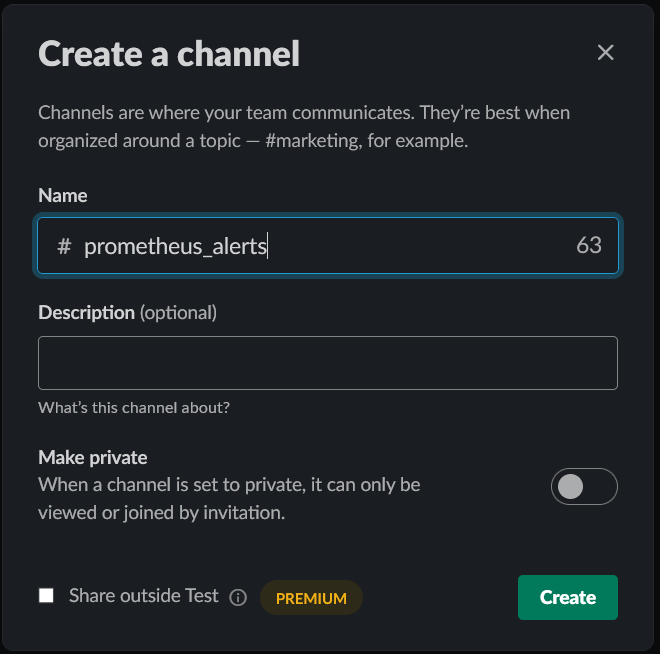
Now, to configure a webhook click on Browse Slack, then Apps, and in the search bar search for webhooks.
Make sure to select the Incoming Webhooks, this is extremely important.
Incoming - it means that data will be sent to Slack, and not received from it.
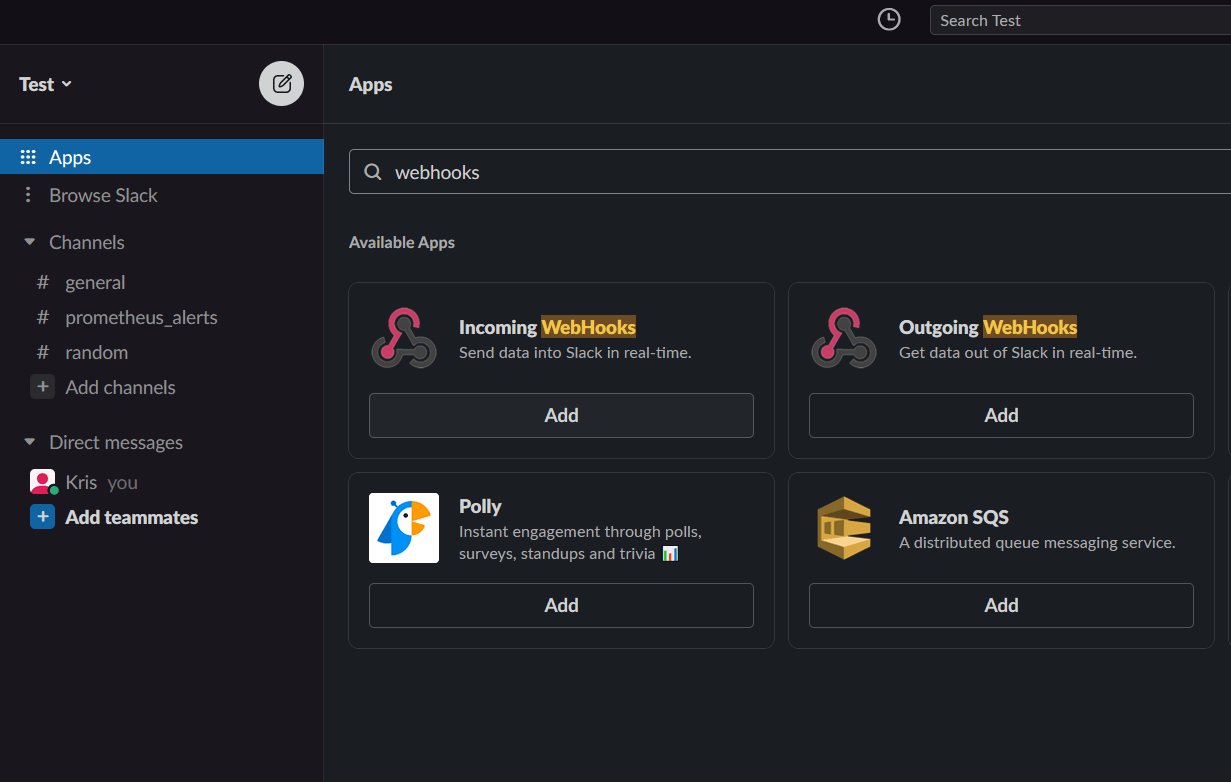
Once you click on Add, you will be redirected to the Slack webhook webpage.
Just confirm with Add to Slack, and choose the previously created alert channel. In our case #prometheus_alerts.
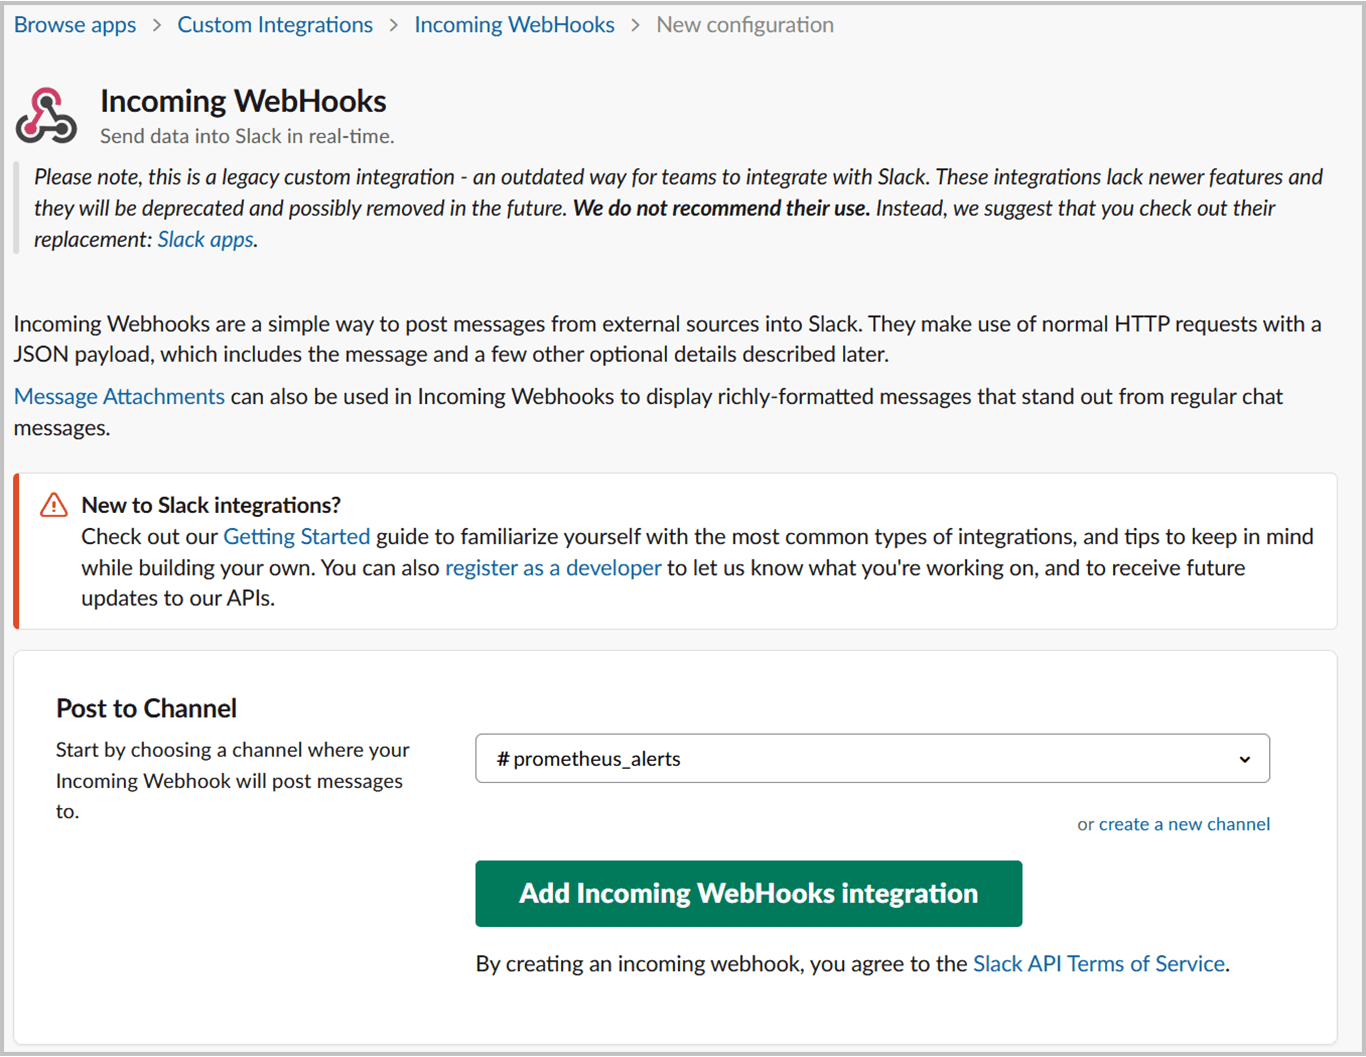
Once that is done on the next page, you will be given the webhook URL.
That looks something like:
Keep this URL a secret, and treat it like a password!
Anyone that gets his / her hands on this URL can send anything to your channel.
At the bottom, there will be an example with curl that you can use to send a request and verify if the webhook integration works.
Going back to your channel, If you see the famous ghost emoji, this means that the webhook configuration is successful.
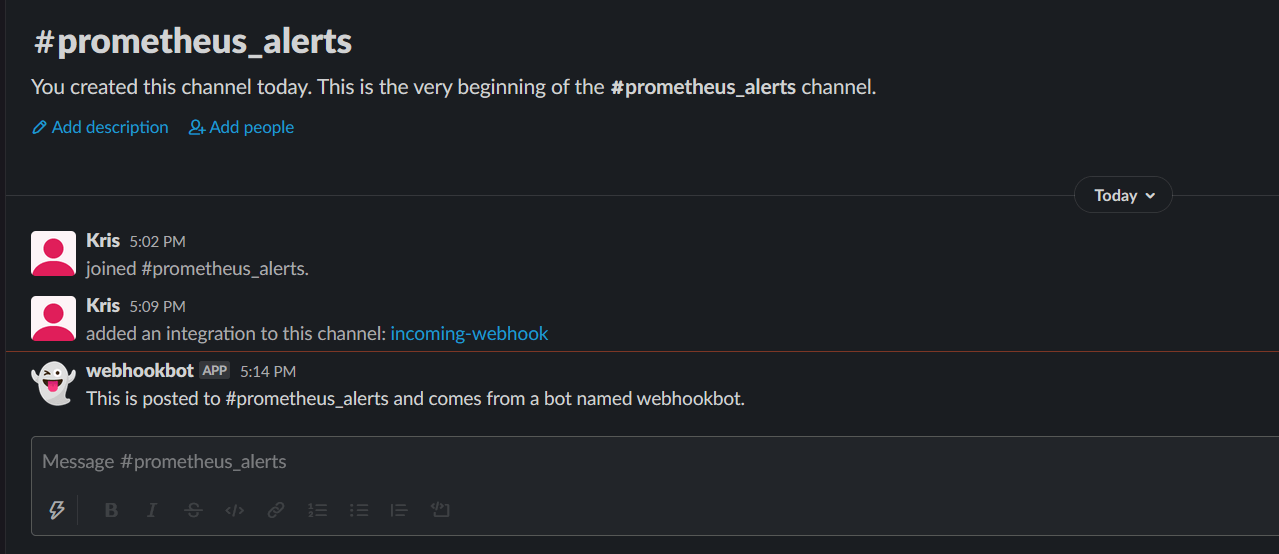
Note: If you received an SSL certificate problem when running the test request, add the -k option to curl.
Configuring Alertmanager
With the Slack channel configured with a webhook, what's left is to integrate it in the Alertmanager configuration.
In other, non-operator deployments, usually the configuration will be stored inside a Config Map.
However, deployed through the Prometheus Operator the configuration will be defined inside a Kubernetes secret.
Which is much better since its contents are encoded and not left in plain-text format. On another note, some additional steps are required when there is a configuration change.
You have two options for editing the Alertmanager configuration:
- You can modify the existing secret that Alertmanager uses to store its configuration.
- You can replace that secret with a new one that contains your updated configuration.
The first option is a bit tedious process since you will need to decode and encode back the contents every time you want to change some of the configurations.
With the second option, you can define and store your configuration in plain YAML format. Once there is a new configuration needed, you can generate the Alertmanager secret, directly from that file.
First, you will need to grab the default configuration that’s deployed with Alertmanager.
You will use that as a base for further editing.
You can output the Alertmanager secret with:
The secret will look messy at first glance.
What you are interested in is in the data field, under the alertmanager.yaml field.
That’s the configuration that Alertmanager uses.
For sake of clarity, the other fields will be truncated.
In this state, you can’t do anything, since the data stored is encoded in base64.
You can either decode it using online free decoders available on the web.
Or you can do it through the terminal:
The above command will echo the contents and pipe them through base64 with the -d option for decoding.
The final, cleaned up configuration will look like this:
Now to add the Slack webhook, a couple of edits will be needed to the configuration.
On the following link from the official docs, you can see what options are available.
Copy the configuration output from above, to a new file named alertmanager.yaml.
In that file, you will need to add three separate configs for Alertmanager in order to send alerts on Slack.
1. Get the Slack webhook URL created previously, and you will add it under the global config as slack_api_url value.
[other data truncated]
2. Under the route section, replace the default receiver Default with slack.
[other data truncated]
3. Create a separate receiver for Slack alerts. Under the channel, add the alert channel name you created earlier.
[other data truncated]
Victory is close!
For you to be able to add this new configuration as a new secret, you must first delete the existing one:
secret "alertmanager-main" deleted
Now create a new secret with the exact same name, and using the alertmanager.yaml file:
secret/alertmanager-main created
Finally, be patient and wait a bit for Alertmanager to load the new configuration.
If all is configured properly, you should now see some alerts on your Slack alert channel.
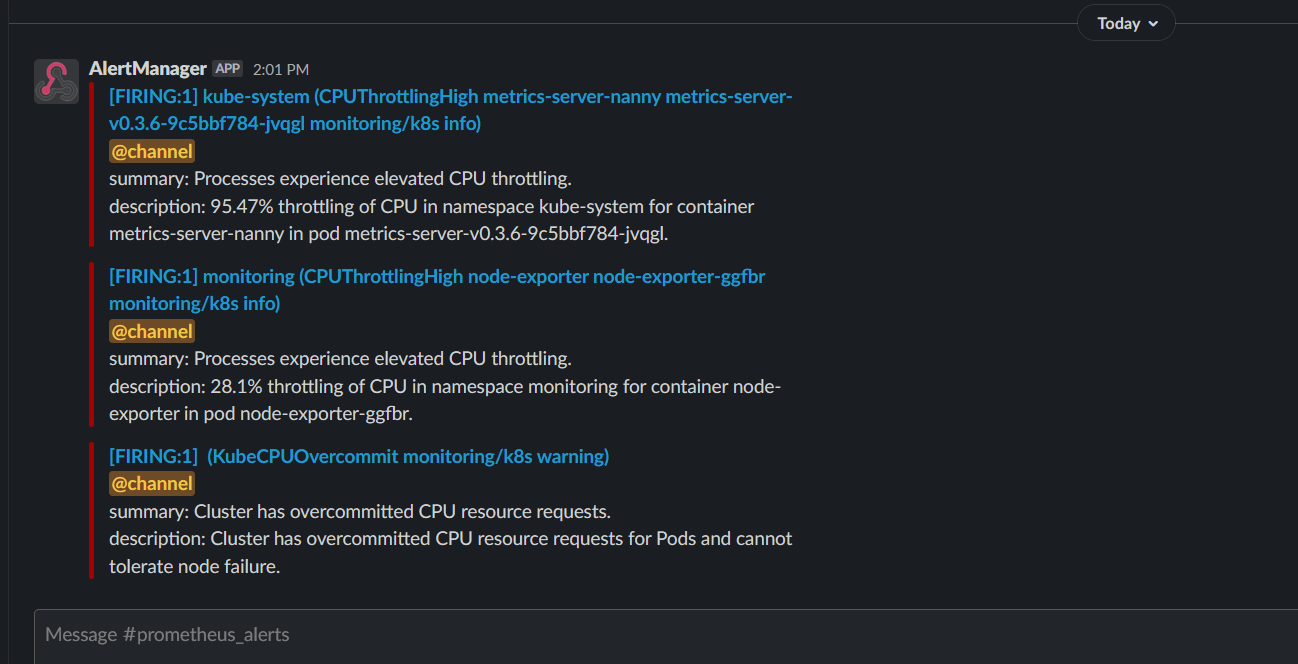
The Alertmanager options are endless, there are a lot of tweaks and fine-tuning that can be done.
You can set the intervals, group methods, different receivers, alert severity, you can even configure the alerting messages however you like.
Above is just a sample to showcase the basic configuration options.
Recap
Let’s recap on what you’ve learned from this tutorial:
- You learned more about Infrastructure Monitoring
- Got familiar with Kubernetes Operators
- Installed kube-prometheus operator as a monitoring solution on your cluster
- You learned how the Prometheus components communicate with each other
- Added your own custom alerting rule
- Configured Alertmanager to send alerts to a Slack channel using webhooks
From the team at Squadcast, we encourage you to keep on learning!
Squadcast is an incident management tool that’s purpose-built for SRE. Your team can get rid of unwanted alerts, receive relevant notifications, work in collaboration using the virtual incident war rooms, and use automated tools like runbooks to eliminate toil.

