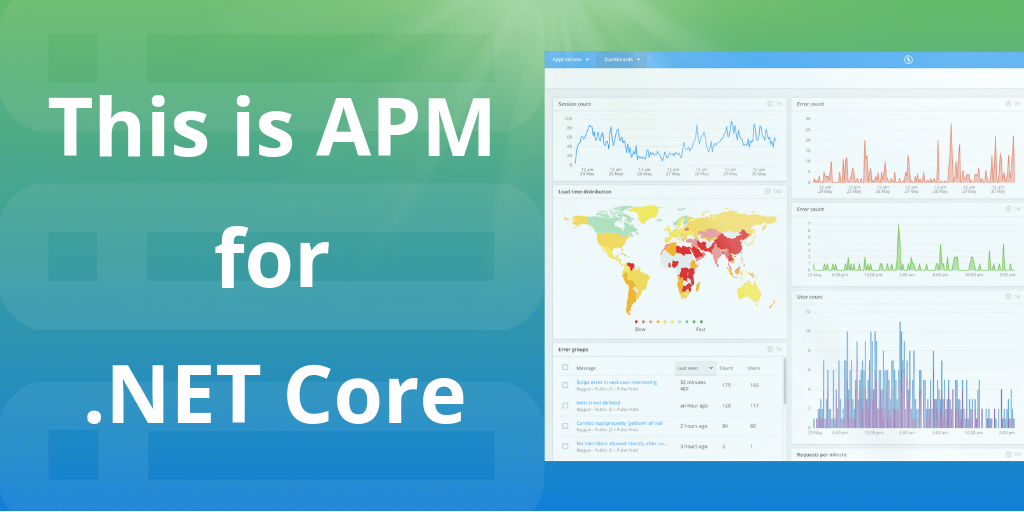
.NET Core support is here for Raygun APM
Today, we’re proud to announce the next chapter for Raygun APM – support for .NET Core. (Windows only).
Raygun is a breath of fresh air for modern development teams needing an APM solution, and our latest language support is no different. In this release, we’re harnessing the power of .NET Core for Windows to bring exciting new features like multithreading and source code integration, so you can offer flawless digital experiences for your customers.
Note: We will be announcing Linux support shortly-watch this space!
Why Raygun APM?
Raygun takes a refreshing approach to performance monitoring. When we first asked our customers about what’s missing in the APM space, we got the feedback that most APM tools lack the ability to give meaningful data to developers, making debugging and troubleshooting difficult.
The next problem is that with current pricing models, APM tools are inaccessible to companies operating in modern development environments, for example, microservice and containers.
Raygun’s APM is different—our goal is to provide a developer-friendly product that excels in delivering the necessary details needed to fix problems quickly.
How does Raygun APM for .NET Core help debug issues faster?
We’ve made sure to compliment .NET Core by adding extra functionality to Raygun APM, including multithreaded trace capture. Here’s how you can use this extra support to help you get more clarity into performance problems.
Multithreaded traces
.NET Core was built from the ground up for performance and with asynchronous code execution at its core. To support this we’ve optimized the Raygun flame chart for displaying multithreaded traces. Raygun now has a UI that enables you to see how and when threads are starting and visualize threads being blocked in your code. As part of this optimization, we’ve also:
- Redesigned how the time range works with multithreaded traces
- Redesigned how threads get collapsed
- Added in functionality to indicate where threads are spawned and how threads are related
- Ability to group threads that are spawned from the same call
Crash Reporting support
The problem with using separate crash reporting and APM tools is that it is hard to correlate details like time stamps. Wouldn’t it be nice to get the information you need to reproduce a query without having to configure both? If you have Raygun Crash Reporting integrated, you can do this in just one click. Head to the trace in APM, see the exact query that caused the error and get the details you need from Raygun Crash Reporting.
Features and integrations available on launch
Raygun APM works with your current development environment and already has all of the features you need to diagnose issues quickly. Here’s what’s available on launch.
- Detailed transaction tracing
- Dashboards
- User experience reporting
- Real User Monitoring
Integrations are available on launch, too, including:
- GitHub
- Slack
- Jira Software
- PagerDuty
- VictorOps
For more details head to our integration documentation.
What the future holds for Raygun APM
In the coming months, we will be adding more integrations and features to the Raygun Platform.
Expect features like custom reporting, deployment tracking, focused dashboarding, high-level metrics and service discovery.
Get started
Raygun APM is so easy to set up that many teams have had data flowing in just two minutes.
New to Raygun? Try APM for .NET Core on a free 14-day trial.
Already a Raygun customer? Head to the setup instructions in the documentation.
Raygun is currently available for .NET, Azure App Service, and .NET Core, but watch this space for Ruby on Rails, Node.js, and Java (and more). Request to be notified when your language becomes available.

