
From Telemetry to Shared Understanding: Why Operations Teams Need Better Visual Incident Notes

Modern operations teams are rarely short on data. A production incident can generate thousands of log lines, multiple dashboards, traces across several services, deployment events, alerts, chat messages, and customer reports. The harder problem is turning that data into shared understanding quickly enough for people to act.
This is why visual incident communication is becoming an important discipline for SRE, DevOps, platform engineering, and IT operations teams. Observability tools help teams collect and query telemetry. Incident management tools help coordinate response. But between those two layers, teams still need a clear mental model of what happened, what changed, what was affected, and what should be improved next.
Text-only incident notes often fail at that job. They may capture every timeline detail, but they do not always show how services interacted. They may list every alert, but they rarely explain why one alert mattered more than another. They may document a root cause, but leave future readers unsure how the failure moved through the system.
Visual notes fill that gap.
Observability data needs context
Observability is built from signals such as metrics, logs, and traces. Each signal answers a different operational question. Metrics show changes in behavior over time. Logs preserve event-level details. Traces reveal how requests travel across services. Together, they can explain a system's behavior.
The challenge is that these signals rarely arrive as a neat story.
During an incident, an engineer may start with an alert about latency, move to traces to identify a slow dependency, check logs for errors, inspect a recent deployment, then compare infrastructure metrics to see whether saturation played a role. Another engineer may approach the same incident from a customer report or a failed job. Both may be correct, but their understanding can remain fragmented unless the team creates a shared representation.
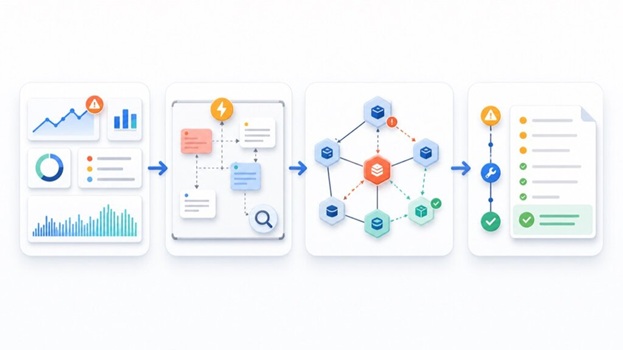
A simple diagram can make that representation visible. It can show the affected user path, the services involved, the dependency that degraded, the fallback that failed, and the control that prevented a wider outage. It does not replace telemetry. It turns telemetry into a map.
The best incident visuals are intentionally simple
Incident diagrams do not need to look like polished architecture posters. In fact, overly detailed architecture diagrams can slow people down. The best incident visuals are small, focused, and tied to a specific question.
For example:
- Which user journey was affected?
- Which service first showed abnormal behavior?
- Which downstream systems were impacted?
- Which alerts fired, and which were symptoms rather than causes?
- Which manual action or automated safeguard restored service?
- Which part of the system needs a follow-up change?
An effective incident visual usually includes five elements:
- The affected entry point, such as an API, queue, scheduled job, or customer-facing workflow.
- The critical dependencies involved in the failure path.
- The direction of impact, shown with arrows or a timeline.
- The telemetry evidence that supports the explanation.
- The follow-up action that reduces repeat risk.
This structure keeps the diagram useful. It prevents the team from creating a decorative picture and instead forces the visual to answer an operational question.
Visuals improve postmortems without weakening blameless culture
Strong postmortems are not about assigning blame. They are about learning how a system behaved under real conditions and making that system more resilient. Visuals can support this because they shift attention away from individuals and toward interactions, assumptions, dependencies, and feedback loops.
Instead of writing, "The on-call engineer missed the alert," a visual postmortem can show that three alerts fired at once, the critical one was not clearly distinguished, and the runbook did not identify the dependency that later proved important. That kind of framing makes it easier to discuss operational design rather than personal failure.
Visuals also help non-specialists participate. Product managers, support teams, security teams, and executives may not understand every trace or log query, but they can understand a diagram showing the affected workflow and the control that failed. This matters because incident learning often requires cross-functional action.
AI can help, but humans must own the explanation
AI-assisted documentation is useful when it speeds up the first draft of a diagram or helps convert messy notes into a clearer structure. For example, an engineer can summarize an incident timeline and ask an AI tool to propose a service map, a failure sequence, or a recovery workflow. A tool such as an AI scientific illustration tool can also help teams turn a technical explanation into a cleaner visual that is easier to review, share, and refine.
But AI should not be treated as the source of truth. In operations work, accuracy matters more than speed. A diagram generated from incomplete notes can mislead a team if it invents relationships, exaggerates causality, or hides uncertainty.
The right workflow is human-in-the-loop:
- Engineers collect the evidence from alerts, logs, metrics, traces, deployments, and customer reports.
- The team writes a short explanation of the suspected failure path.
- AI assists with turning that explanation into a draft visual.
- Engineers review the diagram against the actual telemetry.
- The final diagram is attached to the postmortem or runbook only after validation.
This approach keeps the speed benefit without outsourcing operational judgment.
Where visual incident notes belong
A visual incident note is most valuable when it becomes part of the team's operating memory. It should not disappear in a chat thread after the incident ends.
Good places to store incident visuals include:
- Postmortem documents
- Service ownership pages
- Runbooks
- Architecture decision records
- On-call training material
- Internal reliability reviews
The diagram should also evolve. The first version may describe what happened during the incident. A later version can show the improved design after remediation. Comparing the two is often more useful than a long paragraph explaining that the team "added safeguards."
A practical habit for the next incident
Teams do not need a large process change to start using visual incident communication. The next time an incident closes, add one question to the postmortem template:
"What is the simplest diagram that would help a new engineer understand this incident six months from now?"
If the answer is "none," skip it. But if the incident involved multiple services, unclear ownership, cascading symptoms, or confusing alerts, create the diagram. Keep it small. Tie it to evidence. Review it with the engineers who handled the incident.
The goal is not prettier documentation. The goal is faster shared understanding. In complex systems, that understanding is one of the most important reliability tools a team can build.