Operations | Monitoring | ITSM | DevOps | Cloud

May 2024

It is the time to simplify Observability!

I come from the database world where observability, or monitoring as we used to call it, was always really important to keep databases up and running and operating well. Thousands of data points would be collected and displayed in countless graphs. As an expert DBA, you can see every detail about internal database operations and feel very good about yourself being able to put all this data together and resolve the puzzle.

Coroot v1.0: Unified Observability for Heterogeneous Infrastructures

In the current cloud-native era, almost every organization has one or more Kubernetes clusters in their production infrastructures. However, only a small percentage of companies, especially enterprise-level ones, can claim that they are fully committed to running everything exclusively on Kubernetes. The most typical scenario is that new stateless services are deployed on Kubernetes, while legacy applications, third-party services, and databases continue to run on dedicated VMs or bare-metal nodes.

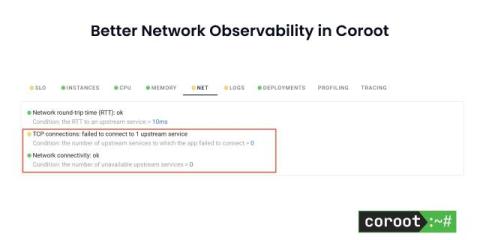
Better Network observability in Coroot

One service can’t connect to another (or can’t establish a database connection) – underneath this simple definition, there can be two very different conditions. First – we may have a service process down. In this case, the Kernel stack is operational, so we are getting the packet back, indicating the connection was refused. Second – when network flow is completely disrupted due to connectivity issues, firewall, or a node being completely down.

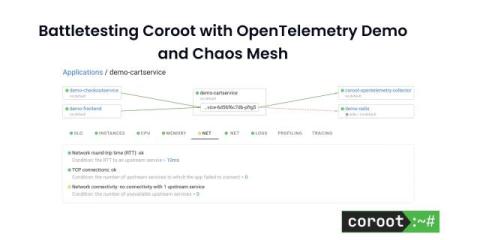
Battletesting Coroot with OpenTelemetry Demo and Chaos Mesh

The most effective method for evaluating an observability tool is to introduce a failure intentionally into a fairly complex system, and then observe how quickly the tool detects the root cause. We’ve built Coroot based on the belief that having high-quality telemetry data enables us to automatically pinpoint the root causes for over 80% of outages with precision. But you don’t have to take our word for it—put it to the test yourself!

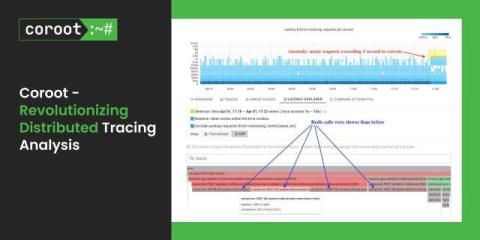
Coroot v1.0: Revolutionizing Distributed Tracing Analysis

We’re excited to announce Coroot v1.0 – our first stable version. It includes some great improvements, such as a new Distributed Tracing interface that takes troubleshooting to the next level. In this post, we’ll compare existing open-source distributed tracing tools, identify unsolved problems in the troubleshooting process, and see how Coroot can address them with its brand-new distributed tracing feature. These days, software is getting more complicated.

Introducing Coroot

We’re Nik and Anton, founders of Coroot. We’ve built a tool that boosts the reliability engineering skills of your team. Think of it as your personal assistant who has not only found the root cause of an outage but also suggested a list of possible fixes. Having a background in managing IT ops teams and building a cloud monitoring platform, here are my observations based on my experience: We’ve built Coroot under the belief that more than 80% of issues can be detected automatically.