Operations | Monitoring | ITSM | DevOps | Cloud
Under the Hood With Splunk Observability
Network Observability for Distributed Services
Explainer Video: Splunk for Infrastructure Monitoring and Troubleshooting
End-to-End Observability Drives Great Digital Experiences
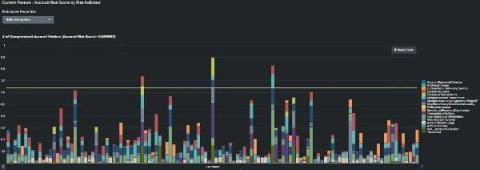
Using Maths to Fight Financial Crime
Financial crime has become a red-hot topic over the last 12 months, as fraudsters have sought to exploit the monitoring gaps between people, process and technology across an ever-widening attack surface – driven by the growth in usage of remote (digital) channels. Even before its recent growth, the cost of fraud and financial crime was significant.
How Can Companies Integrate Ethical AI? | Splunk's Ram Sriharsha & Dr. Rumman Chowdhury
Getting Started with the Splunk Distribution of OpenTelemetry Java
Splunk Distro for OpenTelemetry is a secure, production-ready, Splunk-supported distribution of the OpenTelemetry project and provides multiple installable packages that automatically instruments your Java application to capture and report distributed traces to Splunk APM (no code changes required!), making it easy to get started with distributed tracing!
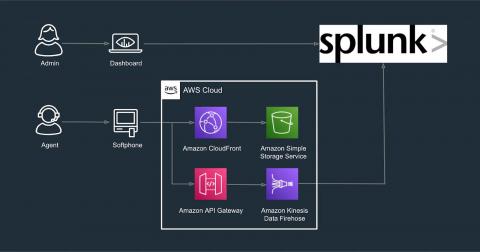
Splunk App for Amazon Connect: End-to-End(point) Visibility for an Optimal Customer Experience
How do you ensure a customer experience (CX) that leaves both participants of a conversation not just satisfied, but elated afterwards? And how do you do that, thousands of times over the course of a day and millions of times a year?
Splunk and Zscaler Utilize Data and Zero Trust to Eradicate Threats
The past year has challenged us in unimaginable ways. We kept our distance for the greater good, while companies faced the daunting task of transforming their workforce from in-person to remote — practically overnight. This presented a unique challenge for cybersecurity teams. How would they ensure employees retained access to critical data in a secure way? Working in the cloud has made remote work easier for many organizations, but has also presented new risks.
Streamlining Vulnerability Management with Splunk Phantom
Vulnerabilities are weaknesses in the security infrastructure that bad actors can exploit to gain unauthorized access to a private network. It is nearly impossible for security analysts to patch 100% of the vulnerabilities identified on any given day, but a vulnerability management plan can ensure that the highest risk vulnerabilities (those that are most likely to cause a data breach), will be addressed immediately.
How 5G Can Elevate the Customer Experience in Retail
Leading retailers have an ambitious vision for what data and connectivity can do in the physical shopping space, and brick-and-mortar retail is already rapidly transforming the shopping experience with technologies such as IoT, VR, AI and cloud computing.
Monitoring AWS EC2 with Splunk Observability
Today, much of our online world is powered by cloud computing, and Amazon Web Services offers an amazing depth and breadth of available services. However, most of the time it starts with Amazon Elastic Compute Cloud, EC2. EC2 is powered by virtual servers called instances and allows users to provision scalable compute capacity as desired. This means no server hardware investment and the ability to scale up or down in response to demand (thus elastic).
Full-stack monitoring for code-to-cloud visibility
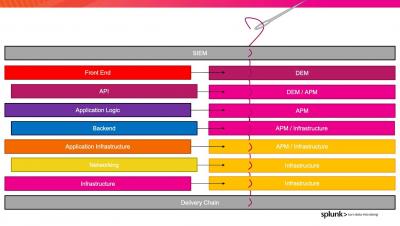
The 7 Hues of DevOps
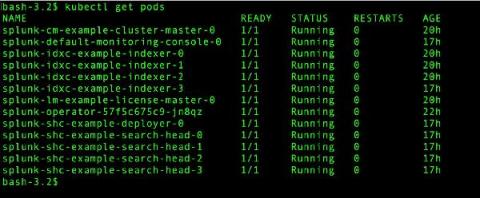
Going Live: Splunk Operator for Kubernetes 1.0.0
With everything going on in the world, it seems like a lifetime ago that we started talking about the Splunk Operator for Kubernetes, which enables customers to easily deploy, scale, and manage Splunk Enterprise on their choice of cloud environment. During that time, we’ve heard from an increasing number of on-premise and public cloud Bring-Your-Own-License Splunk customers that containerization and Kubernetes are an important part of their current and future deployment plans.
Monitoring Pulse Connect Secure With Splunk (CISA Emergency Directive 21-03)
To immediately see how to find potential vulnerabilities or exploits in your Pulse Connect Secure appliance, skip down to the "Identifying, Monitoring and Hunting with Splunk" section. Otherwise, read on for a quick breakdown of what happened, how to detect it, and MITRE ATT&CK mappings.
Elevate Your Cloud Security Posture with Splunk and Google Cloud
It’s more critical than ever to secure your company data and protect your workloads in the cloud. This blog post is a roundup of the latest technical resources and product capabilities by both Google Cloud and Splunk to enhance your threat prevention, detection, and response techniques, regardless of where you are in your business-transforming cloud journey.
Up Close Monitoring with SignalFlow
It’s April, and that means it’s Mathematics and Statistic Awareness month. And in our everyday world of monitoring and observability, both play an ever-increasing role in how we keep track of our environments, both our apps and our infrastructure. Our world is no longer about just pinging the server/app to make sure “It’s alive!”.
Introducing Splunk Attack Range v1.0
The Splunk Attack Range project has officially reached the v1.0 release. By achieving this milestone, we wanted to reflect on how we got here, what features we’ve built for v1.0 and what the future looks like for Splunk Attack Range. What is the Splunk Attack Range? 🧐
Up Close Monitoring with AWS Fargate
On our cloud-native journey, we live in a containerized world. Our environments are containers, managed by orchestrators, and living on some level of computing clusters. Of course, that means you are also responsible for managing all those bits, right?
Getting Started with the Splunk Distribution of OpenTelemetry Python
In our last blog, we introduced OpenTelemetry Python v1.0.0 and walked you through instrumenting a Python application and install both the OpenTelemetry API and SDK.
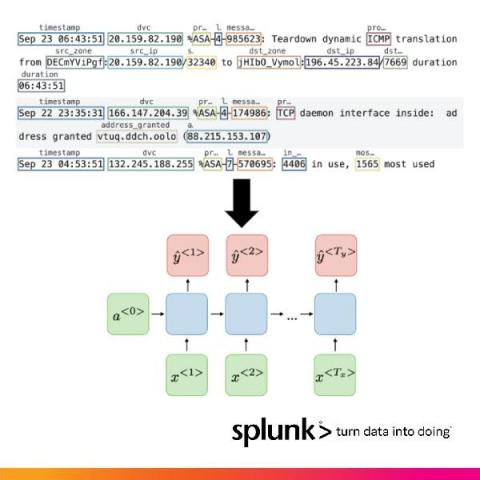
How Splunk Is Parsing Machine Logs With Machine Learning On NVIDIA's Triton and Morpheus
Large amounts of data no longer reside within siloed applications. A global workforce, combined with the growing need for data, is driving an increasingly distributed and complex attack surface that needs to be protected. Sophisticated cyberattacks can easily hide inside this data-centric world, making traditional perimeter-only security models obsolete.
New Splunk Synthetic Monitoring Features Help Integrate Uptime and Performance Across the Entire Splunk Platform
For teams that build or maintain modern applications with their end-users in mind, the acquisition of Rigor means that Splunk now offers the most comprehensive synthetic monitoring solution on the market. Rigor, now Splunk Synthetic Monitoring and Web Optimization, provides best-in-class synthetic monitoring capabilities enabling IT Ops and engineering teams to detect and respond to uptime and performance issues within incident response coordination and throughout software development lifecycles.
Data Is Going to Drive the Continuous Change of Distributed Work
It is said that necessity is the mother of invention, but from necessity also comes innovation. If history has taught us anything, it’s that some of the biggest and best business transformations have arisen from tough times. Over the last year, unsurprisingly one area that has seen a tremendous upheaval is the idea of work and how businesses engage with their workforce.
Cloud Strategy in the Data Age | Splunk's Andy Hershey and Evan Kirstel
Endpoint Security Data Collection Strategy: Splunk UF, uberAgent, or Sysmon?
Many threats originate from the endpoint and detecting them requires insights into what happens on the endpoint. In this post we look at different endpoint activity data sources, comparing the benefits and capabilities of Splunk Universal Forwarder with vast limits uberAgent and homegrown solutions.
Department of Defense Designates Splunk a Core Enterprise Technology
Last month, as part of its continuing efforts to acquire and secure advanced technology for cyberdefense, data analytics and other mission critical operations, the Department of Defense (DOD) designated the Splunk Enterprise Software Initiative (ESI) Blanket Purchase Agreement (BPA) as a Core Enterprise Technology Agreement (CETA). Of the 100+ OEMs that have been awarded a DOD ESI BPA, only seven have been selected for CETA designation by the DOD.
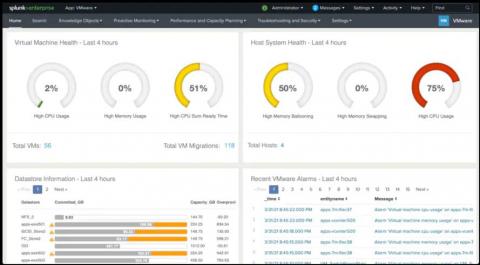
Monitor and Troubleshoot VMware Infrastructure with Splunk
Splunkbase apps are very popular among IT administrators and provide out-of-the-box content for different infrastructure types such as Windows, Unix, VMware, and AWS. As customers expanded their need for more infrastructure types, they historically had to manage and leverage multiple apps.
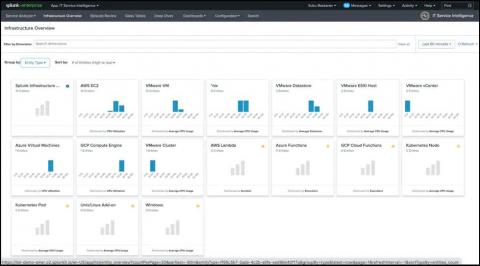
Splunk IT Essentials Work: A Centralized App for All Things ITOps
Splunkbase apps are very popular among IT administrators and provide out-of-the-box content for different infrastructure types such as Windows, Unix, VMware, and AWS. As customers expanded their need for more infrastructure types, they historically had to manage and leverage multiple apps. We have now introduced IT Essentials Work, one centralized app that provides a simpler way to monitor and troubleshoot across different infrastructure types without having to install and maintain different apps.
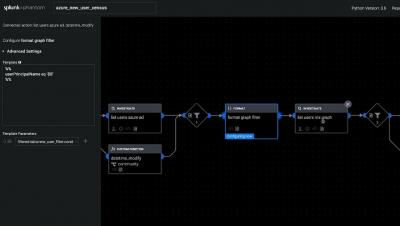
Splunk SOAR Playbooks: Azure New User Census
Taking Automation Beyond the SOC With Advanced Network Access Control
Security orchestration, automation and response (SOAR) tools are most commonly known for automating manual security operations processes in order to expedite security investigations or cyber response. For instance, Splunk’s SOAR technology, Splunk Phantom, is most commonly used to automate alert triage, phishing investigation and response, threat hunting and vulnerability management.
Splunk Machine Learning Environments (SMLE) Labs Beta Demo
Advanced Link Analysis: Part 2 - Implementing Link Analysis
Link analysis, which is a data analysis approach used to discover relationships and connections between data elements and entities, has many use cases including cybersecurity, fraud analytics, crime investigations, and finance. In my last post, "Advanced Link Analysis: Part 1 - Solving the Challenge of Information Density," I covered how advanced link analysis can be used to solve the challenge of information density.
AWS IAM Privilege Escalation - Threat Research Release March 2021
The Splunk Threat Research Team recently developed an analytic story to help security operations center (SOC) analysts detect adversaries attempting to escalate their privileges and gain elevated access to Amazon Web Services (AWS) resources. In this blog, we’ll walk you through an AWS privilege escalation analytic story, demonstrate how we simulated these attacks using Atomic Red Team, collect and analyze the AWS cloudtrail logs, and highlight a few detections from the March 2021 releases.
Splunk Developer Spring 2021 Update
The cold season is hopefully coming to an end, and Spring is here! And just like the changes in the seasons, we have a new SDK release, updated developer docs, and other signs of new growth! It’s a great time to update your apps using the latest SDKs for the latest Splunk Cloud and Splunk Enterprise releases. Plant your session proposal in the .conf21 Call For Speakers! It's also time to prune away some older jQuery and Python versions support. Read on for the latest news.
Splunk > Clara-fication: Dashboarding Best Practices
So you want to build a better dashboard, do you? Well good, you’ve come to the right place! Splunk dashboards are amazing. They are incredibly versatile and customizable. The creation of a dashboard is incredibly simple and can be done all through the UI. If more in-depth customization is required, that can be done through the SimpleXML using HTML panels, in-line CSS, or by uploading a new app from Splunkbase or custom JS/CSS.
Getting Started with OpenTelemetry Python v1.0.0
Since the OpenTelemetry Tracing Specification reached 1.0.0 — guaranteeing long-term stability for the tracing portion of the OpenTelemetry clients, the community has been busy working to get the SDKs and APIs for popular programming language ready to be GA. Next in our ‘Getting Started with OpenTelemetry’ Series, we’ll walk you through instrumenting a Python application and install both the OpenTelemetry API and SDK.


