Operations | Monitoring | ITSM | DevOps | Cloud
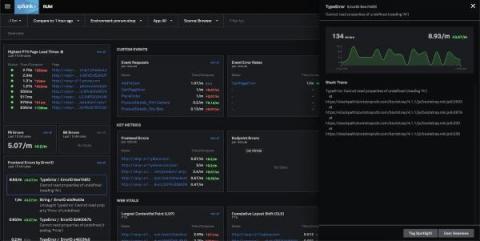
Splunk RUM Frontend Error Monitoring is Now Generally Available!
Debugging errors is an essential component to SRE and developer workflows. “How do we prioritize and isolate JavaScript errors more effectively?” is a top challenge we hear from engineering teams looking to improve end-user experience. Therefore, we are excited to announce the general availability of Splunk RUM frontend error monitoring.
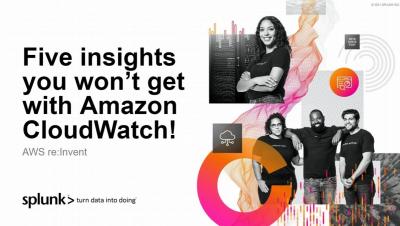
Five Critical Insights You Won't Get With Your Cloud Provider's Monitoring Solution Alone
When meeting with a current or prospective Splunk customer, one question we are often asked is “Why do I need Splunk when I can just use AWS Cloudwatch, Azure Monitor, or GCP Cloud Operations Suite (formerly known as Stackdriver) for my cloud monitoring needs?” And what a great question it is!
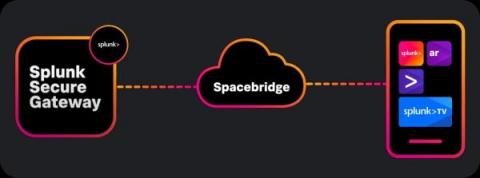
Splunk Mobile, iPad, AR and TV in Private Networks
Having Splunk Mobile available in your pocket is great, but what if you're not able to take advantage of it because of Defense Federal Acquisition Regulation Supplement (DFARS) requirements or security concerns? Through this blog post, you'll learn how deploying a Private Spacebridge might be the right answer!
Splunk AR - What's new .conf 2021
Enabling the Self Driving Cloud with Splunk Observability Cloud and GKE Autopilot
In 2021, any time that you access any kind of web service, whether it be via a website or app, chances are high that the backend is running on Kubernetes. Hundreds of thousands of organizations rely on Kubernetes to power and manage their mission critical services every day, and the reliability and scalability benefits offered by Kubernetes have been felt across the industry.
Splunk Cloud Self-Service: Announcing The New Admin Config Service API For Private Applications
In our last blog, "Splunk Cloud Self-Service: Announcing the Admin Config Service (ACS)" we introduced our modern, cloud-native API that is enabling Splunk Cloud Platform admins to manage their environments in a self-service fashion. In this blog, we take a look at our latest effort to empower our customers: ACS private app management.
High Five: The Latest Integrations from Splunk, Microsoft and GitHub
Hello Splunk Nation! Welcome to the latest roundup of Splunk integrations with Microsoft and GitHub! Hopefully, you had a chance to virtually attend.conf21 and check out all the amazing content. For those of you who missed it, we’re recapping the Microsoft, GitHub and Splunk highlights below.
Atlassian: Accelerating Observability in the Data Age
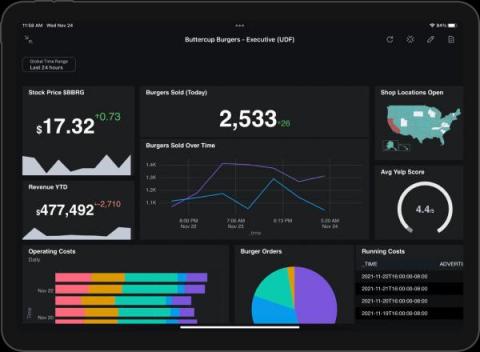
Introducing... Splunk for iPad!
Are you busy and on the go but still need to dig into your data and view your dashboards? We’ve got you covered — introducing… Splunk for iPad! Splunk for iPad is designed for and dedicated to what’s unique and great about the iPad, taking full advantage of its portable and interactive nature with unique dashboard annotation and note-taking features.
Why Data Maturity Matters | Prof. Sally Eaves, Ronald van Loon and Splunk's Mark Woods
Performance Testing Tools: 8 to Help Find Your Bottlenecks
Performance is a vital component of user experience. Users will leave—and likely not come back—if your site is slow. If they stay, they’ll be less likely to buy from you if their experience is subpar. To add insult to injury, they’re even less likely to find your app to begin with, since Google punishes poorly-performing sites in the search results. To solve the problem of poor performance, knowledge of what impacts performance is essential.
Live from AWS re:Invent - Data Drivers & Racing as a Service
Live from AWS re:Invent - Data Drivers and The Race To Observability
Live from AWS re:Invent - Time Travel with Splunk and AWS
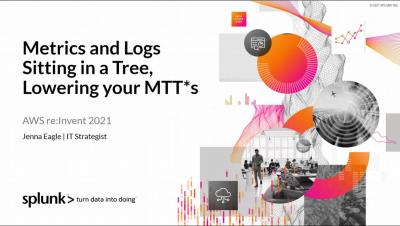
Live from AWS re:Invent - Metrics and Logs Sitting in a Tree, Lowering your MTT*s
Five things everyone needs to know about their AWS environment that they can't see from Cloudwatch
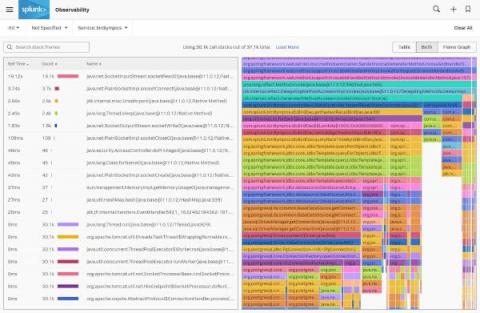
Announcing the GA of Splunk APM's AlwaysOn Profiling
As an update to.conf’s announcement of our continuous code profiling preview, we’re excited to share that today Splunk APM’s AlwaysOn Profiling is generally available for Java applications, included in APM with no additional cost. Here’s a quick walkthrough of the feature, and how you can get started now.
How to Deploy the Splunk OpenTelemetry Collector to Gather Kubernetes Metrics
With Kubernetes emerging as a strong choice for container orchestration for many organizations, monitoring in Kubernetes environments is essential to application performance. Kubernetes allows developers to develop applications using distributed microservices introducing new challenges not present with traditional monolithic environments. Understanding your microservices environment requires understanding how requests traverse between different layers of the stack and across multiple services.
Splunk Mobile for Private Networks
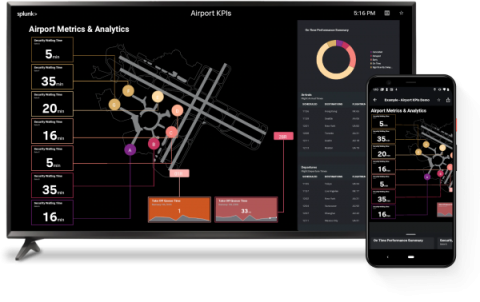
Dashboard Studio on the Go
We heard that you love telling complex data stories by building beautiful dashboards on Splunk Dashboard Studio. Now get these dashboards into the hands of even more users anywhere at any time with Dashboard Studio on Splunk Mobile and Splunk TV.


