Operations | Monitoring | ITSM | DevOps | Cloud
Shipping Terraform Logs with the Logz.io Provider & API
Logz.io has deepened its partnership with Hashicorp over the last few months. Recently, we announced our integration with their service mesh, Hashicorp Consul. Simultaneously, we have worked on and completed an integration with their infrastructure orchestrator (a.k.a, infrastructure-as-code or IAC), Terraform. IACs take manual configurations and treats them as, well, code (along with procedures, build guides, run books, etc.).
Investigate Stormshield & SonicWall Events with Logz.io Cloud SIEM
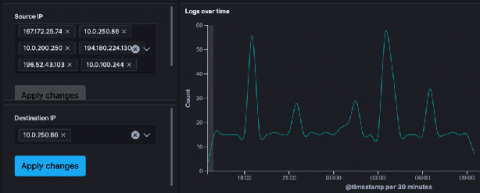
Stormshield and SonicWall are popular firewalls used to monitor network traffic for malicious actors. Firewalls can help detect all kinds of attacks, like brute force logins, DDoS, and SQL Injection, but they just make up a piece of the security puzzle. Most teams will have many other security tools that address different kinds of vulnerabilities and attacks.
Secure Your Endpoints with Trend Micro & Logz.io
Trend Micro Cloud One is a strong enterprise data security solution for data centers and cloud environments. Trend Micro’s advantages, like most other security tools, lie in its pairing with other security resources. That’s where Logz.io comes in. It brings together disparate data that Trend Micro tracks to create fully summarized dashboards and extremely detailed ones with specific focuses.
Jaeger Essentials: Distributed Tracing from Dapper to Jaeger
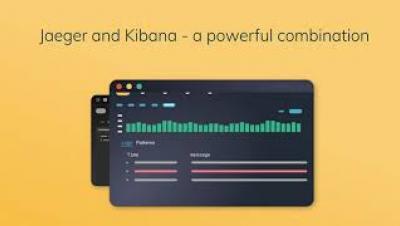
If you are dealing with microservices, serverless architecture, on any other type of distributed architecture, you have probably heard the term “Distributed Tracing.” You may have been wondering what it’s all about, and where should you start, in this post, I’ll tell you about the journey we passed at Duda, from the day we heard about distributed tracing and started to explore whether it will be useful to use it in our company, to the exploration on what is distributed tracing a
5 Things to Know When Choosing Open Source SIEM Tools
Security Information and Event Management (SIEM) tools focus on insights into IT environments and tracking records of all their operations. These IT environments can be application infrastructures, physical networks, and cloud networks. SIEM initially evolved from the log management discipline, which involved integrating security events with security information to collect, analyze, and report on activities in networks.
Kibana Visualization How-to's: Heatmaps
In Kibana you have a full selection of graphical representations for your data, most of the time this can be a simple line or bar charts to do what you need to do. But every so often you need to take a different view to get the most out of your data. Heatmaps are a critical component of the Kibana visualization arsenal, and deserve their own attention.
Logging Golang Apps with ELK and Logz.io
The abundance of programming languages available today gives programmers plenty of tools with which to build applications. Whether long-established giants like Java or newcomers like Go, applications need monitoring after deployment. In this article, you will learn how to ship Golang logs to the ELK Stack and Logz.io. It’s usually possible to get an idea of what an application is doing by looking at its logs. However, log data has a tendency to grow exponentially over time.
Can Distributed Tracing Replace Logging?
Logging has been around since programming began. We use logs to debug issues and understand how software works at the code level. After logging and debuggers, profilers are a dev’s best friend when writing code and may run in production with limits to reduce overhead. As we distributed architectures — making systems more complex — centralized log aggregation was soon necessary. At that point, we had to analyze this data. Hence, log analytics technologies were born.


