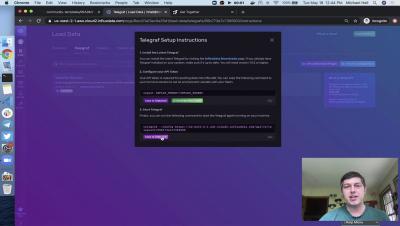
Tracking COVID-19 Data in South America Using Telegraf and InfluxDB
I wanted to better understand how COVID-19 has been developing in South America. As I’ve recently started playing with InfluxDB, the open source time series database, I created a dashboard of cases and deaths using InfluxData’s platform. I usually use InfluxDB, Chronograf, Grafana, Zabbix and other similar solutions to monitor services and systems. However, until this point, I hadn’t used them to process and visualize other kinds of data.


