Operations | Monitoring | ITSM | DevOps | Cloud

Squared Up

Customer Workshop 2023

This month, we were thrilled to welcome SquaredUp customers from all over the world to our in-person workshop in sunny Marlow, UK. It was a wonderful day of learning and sharing ideas, and a unique opportunity for SquaredUp users to meet the people behind the product (us!), network with like-minded customers, and get an exclusive look at the latest product updates. We were excited to showcase our Dashboard Server product roadmap and share our vision for the future of SquaredUp.

Observability at Scale Needs Summary

The shift from traditional monitoring to observability is widespread, and necessary. It's the way we make sense of increasingly complex and distributed systems. But when we capture all this data at scale... what do we do with it all? If this data itself had inherent value, we’d all be rich. But in the real world data does not provide us value until we can act on what it tells us.

Auto-Instrumenting Node.js with OpenTelemetry & Jaeger

Six months ago I attempted to get OpenTelemetry (OTEL) metrics working in JavaScript, and after a couple of days of getting absolutely no-where, I gave up. But here I am, back for more punishment... but this time I found success! In this article I demonstrate how to instrument a Node.js application for traces using OpenTelemetry and to export the resulting spans to Jaeger. For simplicity, I'm going to export directly to Jaeger (not via the OpenTelemetry Collector).

Rapid Performance Analysis using Developer Tools

In the world of performance testing there is a heavy focus on the practice of load testing. This requires building complex automated test suites which simulate load on our services. But load testing is one of the most expensive, complicated, and time consuming activities you can do. It also generates substantial technical debt. Load testing has its time and place, but it's not the only way to measure performance.

Dashboard Stories: Gamified bug bash tracking

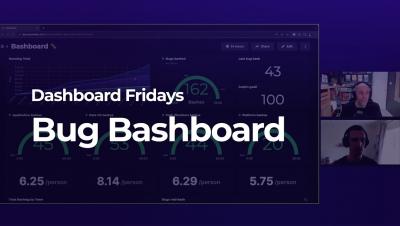
We love a ‘bug bash’ here at SquaredUp, so we regularly encourage our developers and testers to down tools on major features to go after smaller issues that have been 'bugging' them. This dashboard helps us measure the success of the teams latest bug bash and adds a little gamification for some competitive fun! Using the Jira plugin in SquaredUp, we can stream our data on demand into this centralized dashboard for the whole team. Now we can easily see how we're doing against our target, without having to trawl through Jira.

Dashboard Stories: Observing Garden Irrigation water usage with SQL

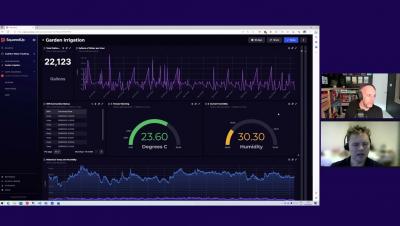
This useful garden irrigation dashboard built in SquaredUp displays a series of data on system availability, water usage and weather conditions. Using the SQL plugin, it pulls data from the Arduino device, allowing me to quickly visualize water usage across any timeframe I choose. This means that I can spot irregularities in usage, which could indicate a leak. I chose to use SquaredUp dashboards for this project, as even though I’m only working with simple data, once you surface it there’s a lot you can do with it!