Operations | Monitoring | ITSM | DevOps | Cloud
WLSDM
WLSDM Blog: Oracle Internet Directory Component Monitoring
In this blog, we will examine the changes in OID 11g and 12c and how to track the component’s health through WLST and WLSDM. Please read complete blog post about the structure of Oracle Internet Directory and related OID component monitoring in WLSDM. Oracle Internet Directory is an LDAP Directory that uses an Oracle Database for storage. OID provides user management and group information from a central location within complex systems.
WebLogic Managed Servers Health States Automation with WL-OPC
WL-OPC (WLSDM OPERATION CENTER) is the operation central and notification system which enables to manage application server infrastructure. You are going to able to manage, organize and visualize with WL-OPC.
Automating WLSDM Upgrade in Multiple Domains
The wlsdm update process is quite simple. wlsdm_agent.jar and wlsdm.war are replaced by new packages. The update steps are exactly as follows.
How to Monitor OID Status and Restart the LDAP Service When OID is Down?
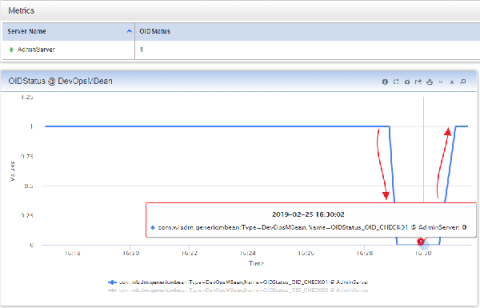
We prepared WLSDM OID DevOps MBean blog about when OID shuts down due to external problems such as a network issue, the system will be provided to stand up. First of all, We are going to create WLSDM DevOps MBean then assign restart script on it. If the dummy LDAP search on DevOps MBean does not return any result, the opmnctl service will be restart by triggering the action script.
Monitor Database and Calculate DB Response Time on WebLogic
There is WLSDM DevOps MBean scripts to monitor WebLogic environments and trigger auto actions. Hope other users will use this topic and share their scripts and let us see what can be done for WebLogic automation.
Analyze Stuck And Hogging Threads
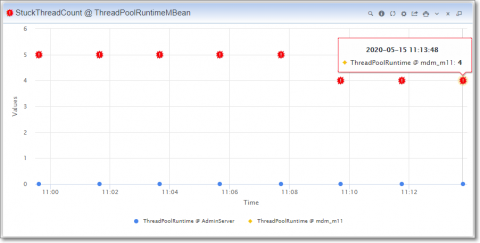
What is Stuck Thread? A Stuck Thread is a thread which is processing a request for more than maximum time that you configured in admin console. By Default, the WebLogic server comes with 600 secs. If some thread doesn’t return in 600 secs, It gets a flag ‘stuck thread’. How to deal with Stuck Thread? Take thread dumps instantly. Open thread dumps in visualVM. Analyze dashboard from WebLogic console (managed server > monitoring > threads).
WebLogic 12c WLST Examples & WLSDM WLST Console
The Oracle Weblogic Scripting Tool (WLST) is stand for monitoring, managing, and configuring Oracle WebLogic Server from the command line. While monitoring WebLogic domains mostly administrators prefer to use WLST (WebLogic Scripting Tool) scripts but there are more efficient and robust way available to monitor WebLogic domain resources like health status and states of servers (JVMs), deployments, data sources and JMS resources etc.
Native Oracle WebLogic & SOA Suite Monitoring
WLSDM is an enterprise “WebLogic console extension” which enables monitoring for WebLogic JMX MBean metrics and all the WebLogic domain assets (Health, Servers, Applications, Data Sources, JMS… etc.). It is very easy to create alarm and notification definitions by using WLSDM metric browser. WLSDM can store any WebLogic metric value historically and also can generate graphical reports.
WebLogic Management WebLogic Performance Issues
Stuck Threads are threads that are blocked, and can’t return to the threadpool for a certain amout of time. By Default, the WLS comes with 600 secs. If some thread doesn’t return in 600 secs, It gets a flag ‘stuck thread’.


