September Launch Notes: APM, zipped source maps, and more
Raygun’s Launch Notes are your regular roundup of all the improvements we made to Raygun in the last month — from major feature releases to performance updates.
If you want find out if end users are running into bugs, slow page load speeds and other hidden issues, or want to discover where and why people are falling out of your conversion funnels, Raygun is going to provide much needed visibility and answers for your team.
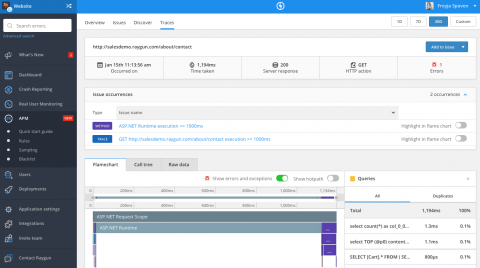
When you’re building software, there’s so much to think about — from bugs to how fast your application loads. We’ve got something new to help your development team build better, faster experiences for your users, in less time. Today, we’re releasing Raygun Application Performance Monitoring (APM) for .NET, a new way to visualize and understand your application’s performance on the server-side.
Have you ever had responsibility for an application and been the last to know about an outage? I have, and it’s terrible. You go to check your phone in the morning over coffee, after waking up, and you see a flood of missed calls and tons of emails. Customers are angry. Your boss is demanding to know what’s happening. Even the company’s executives are involved. How did this happen?
Monitoring remains a critical part of managing any IT system, while the challenges associated with monitoring microservices are especially unique. An example is how traditional monolithic systems, deployed as a single executable or library, have different points of failure and dependencies than those deployed with a microservices architecture.
You work on your software’s performance. But let’s face it: production is where the rubber meets the road. If your application is slow or it fails, then nothing else matters. Are you monitoring your applications in production? Do you see errors and performance problems as they happen? Or do you only see them after users complain? Worse yet, do you never hear about them? What tools do you have in place for tracking performance issues? Can you follow them back to their source?
In an ideal world, bugs would never reach production. But, software errors are an inevitable part of a developer’s life. Java debugging tools exist to help us resolve errors faster, so we can get on with doing what we do best. This list of Java debugging tools will help you evaluate your options quickly so you can find the best for the job.
The Raygun platform is designed to surface as much actionable information about errors so, as a developer, you not only fix them quickly but gain context into what causes errors in the first place. Today we’re announcing a new feature for both Crash Reporting and Real User Monitoring: Crash by device. This new feature helps mobile developers understand which devices cause the most crashes, so replicating errors becomes easier.