Operations | Monitoring | ITSM | DevOps | Cloud

Sysdig

Monitoring Java using JMX and custom metrics

JMX (Java Management Extensions) is a set of specifications conceived to monitor and manage Java applications. To implement the JMX technology, you need to create and register MBeans (Managed Beans) as part of your Java code. Using JMX technology and tools, Java application developers can get the dynamic state of the application and use it for performance tuning, troubleshooting and debugging.

Monitoring Java applications: Memory usage, threads and other JRE metrics

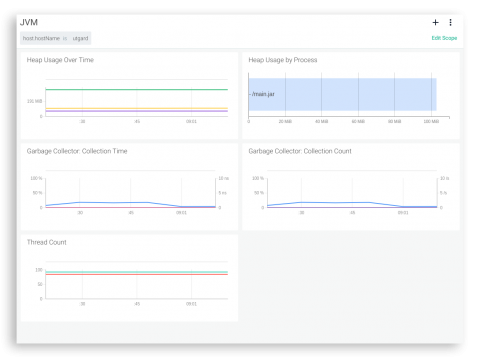
In this post we will cover how to monitor the Java Runtime Environment (JRE). You will learn how to assess the performance of your Java application by profiling its memory usage, the garbage collector metrics, monitoring Java daemon and user threads and other fundamental JRE metrics. We will finish with a real Java JRE troubleshooting example using opensource Sysdig and Docker.

Sysdig Monitor 3.0 - Enterprise-grade Prometheus, Kubernetes insights and more.

Today we announced the launch of enterprise-grade Prometheus monitoring with Sysdig Monitor 3.0. We’ve added new Prometheus capabilities like PromQL, a Grafana plugin and new enhancements for our already rich Kubernetes monitoring. If you love Prometheus like we do, and especially if your cloud environment is growing quickly, read on to learn more about what we’re doing with Prometheus, Kubernetes and more.

Container Monitoring Overview with Sysdig Monitor

Watch this overview of Sysdig Monitor for an in depth look at how to monitor Docker containers, Prometheus metrics and more. Sysdig ContainerVision sees inside containers from the outside and ServiceVision enriches container metrics with service-oriented metadata from Kubernetes, OpenShift, Docker Swarm, and Mesos - DC/OS.

Kubernetes monitoring with Prometheus - Prometheus operator tutorial (part 3).

We covered how to install a complete ‘Kubernetes monitoring with Prometheus’ stack in the previous chapters of this guide. But using the Prometheus Operator framework and its Custom Resource Definitions has significant advantages over manually adding metric targets and service providers, which can become cumbersome for large deployments and doesn’t fully utilize Kubernetes’ orchestrator capabilities.

Announcing Sysdig's $68.5M series D funding.

I am very excited to announce that we closed our $68.5M Series D financing round last month, bringing our total funding to $121.5M. We look forward to partnering with our new investors, Insight Venture Partners, who led this round alongside existing investors, Bain Capital Ventures, and Accel. Our mission is to enable enterprises to run reliable and secure containers and microservices.

Hello to new Sysdig documentation.

I am very excited to share our brand new Sysdig documentation website. Our documentation team has been working very hard for the past few months. They have rewritten the majority of our product and support content and introduced an intuitive navigation structure to help you quickly find what you need. Sysdig Docs are now organized into Platform, Monitor and Secure sections.

Docker scanning for Jenkins CI/CD security with the Sysdig Secure plugin.

In this blog post we’ll cover how to implement Docker Scanning for Jenkins with the Sysdig Secure Jenkins plugin. The plugin can be used in both freestyle and pipeline jobs to scan images and fail the build if the image fails a policy evaluation.