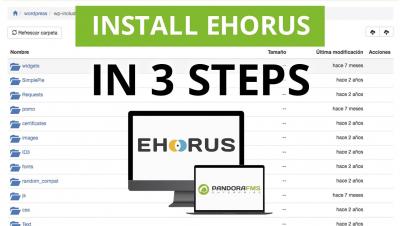
Remote working software eHorus installation in 3 steps | Pandora FMS
In this video you will learn how to install eHorus, our remote working software to control your devices everywhere. You can start using eHorus in 3 simple and easy steps.


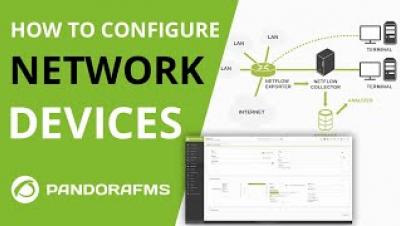
COVID-19 is and will be the talk of the town due to its large-scale social, humanitarian and economic repercussions, but how can it affect a company’s systems? Many employers find themselves in the need to offer their employees remote working options, which means leaving the offices empty without actual machine supervision, which calls for a remote monitoring software to monitor their systems.
The work of an admin or network administrator may seem ordinary, that type of work that just follows a guide, but right now, you could not be further from truth. Here I bring you network scanning, a task that could take a lot of your time… or little, if you have Pandora FMS by your side and with the help of one of those free software applications included in GNU / Linux. Let’s take a look!
In English, the word “present” has two different meanings: the first one is “now”, as in now that you are reading this article, and also the meaning of gift. There is no misunderstanding here, but there is also the adjective “free”, which can mean free, something that does not need to be paid, or having freedom. Today we will see several free applications that you may use as web monitoring tools.
In this update 744, we have added the module library to the console interface. We have also kept improving visual consoles, incorporating a new template with countries, as well as extending the alert correlation editor. Furthermore, our troubleshooting covers more than eighty issues, following our zero bugs 2020 policy.
Pandora FMS and Toshiba met each other on a cold winter morning, they exchanged looks and… This would be a great start to a love story, wouldn’t it? However, the relationship between Pandora FMS and Toshiba has a different nature: teamwork. By now you know Pandora FMS, don’t you? That flexible and complete monitoring software, with which you can monitor all your devices, from networks, servers, UX, IoT, applications or business processes, to virtual environments, etc.
A rack is a structure, usually made out of metal and cabinet or wall-shaped, which allows to store and organize the different components of computer installations, such as servers, storage systems, switches, etc. Is that it? Are you disappointed? Well, hold on, although they don’t seem like much, the world of racks can actually be quite tricky.