Operations | Monitoring | ITSM | DevOps | Cloud
GroundWork
The Value of Correlation
Data that is static or that behaves the same way day-to-day isn’t indicating aberrant behavior. Looking at the correlation of data from today with data from yesterday can tell you if today is different in some way: positive correlation means today is related to yesterday, particularly if deviation is high. Negative correlation with high variability means that today isn’t like yesterday at all.
GroundWork 8.1.0 released!
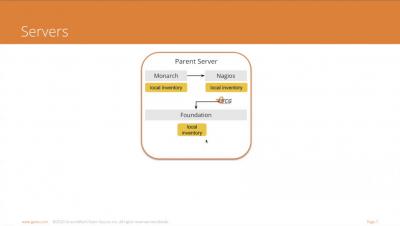
Download 8.1.0 This version of our Enterprise product supports distributed monitoring with multiple GroundWork servers in parent-child configurations, along with an update to our Log Bridge connection to Elasticsearch and Kibana.
The Benefits of Running GroundWork Monitor in Containers
If you have been watching our announcements, you know we have recently released a major new version of GroundWork Monitor Enterprise, version 8. As I write this, that’s actually 8.0.1, which is a little more than the first release. The thing about version 8 though, is that it’s containerized. That’s right, all of the many processes that GroundWork uses to monitor, alert, log, and report on your infrastructure are all running in Docker containers.
Cloud Service Monitoring with GroundWork Cloud Hub
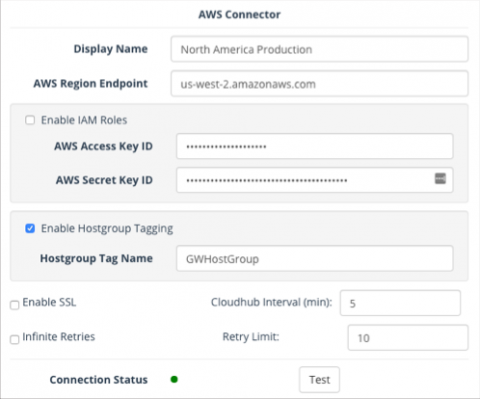
Cloud Computing Services like AWS, Google Cloud and Microsoft Azure are revolutionizing IT infrastructures at a rapid rate. However, businesses have not completely adopted Cloud services, and many of us are still running hybrid on-premise and cloud solutions. The GroundWork solution is to unify all monitoring, whether it be on-premise or in the cloud.
How Unified Monitoring Can Help Make Your IT Life Easier!
Unified Monitoring provides real-time understanding of what is happening, every time and everywhere on the network, and everything connected to it. With Unified Monitoring, engineers are more able to support proactive identification of root causes and deploy the actions and resources needed to maintain the health and integrity of all connected IT assets.
Announcing GroundWork Monitor 8
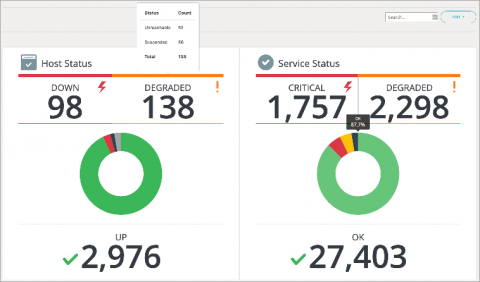
GroundWork Monitor 8 is a new version of a mature product, GroundWork Monitor Enterprise. As such, a lot of what is inside of this version will be familiar to users of prior versions. For example, we are still using the same bundled GPL Nagios™ and GroundWork Distributed Monitoring Agent (GDMA), and we are still including NeDi and Cloud Hub as data feeds. Then again, much is very new. We have completely re-worked the status screens and made them much more responsive.
What Is Unified Monitoring?
Unified Monitoring—or using an integrated platform that monitors your entire IT infrastructure, including physical, virtual, and cloud—is a proven strategy for reducing service outages, increasing end user and IT productivity, optimizing capital investment, and maintaining industry compliance. The business community has long recognized that productivity and profitability depend upon the smooth functioning of their entire IT environment.
Who Can Benefit From Unified Monitoring
Unified monitoring is for any organization that uses IT operations extensively in their business. Many times, the organizations who need unified monitoring have experienced outage and availability issues, have in-house solutions that struggle to scale or don’t meet regulatory requirements, lack of visibility into their infrastructure, or don’t have the ability to do reporting (for example: SLA compliance reports).
4 Tips To Monitor Modern Cloud-based Applications & Infrastructure
Modern cloud-based application and infrastructure monitoring is a moving target. And it is one that very much depends on how “native” your cloud application is. Here is a list of monitoring metrics capabilities you should look for that pertain to time series and events.


